

- FLOKI is trading at $0.0000260 with an intraday rise of 4.8%.
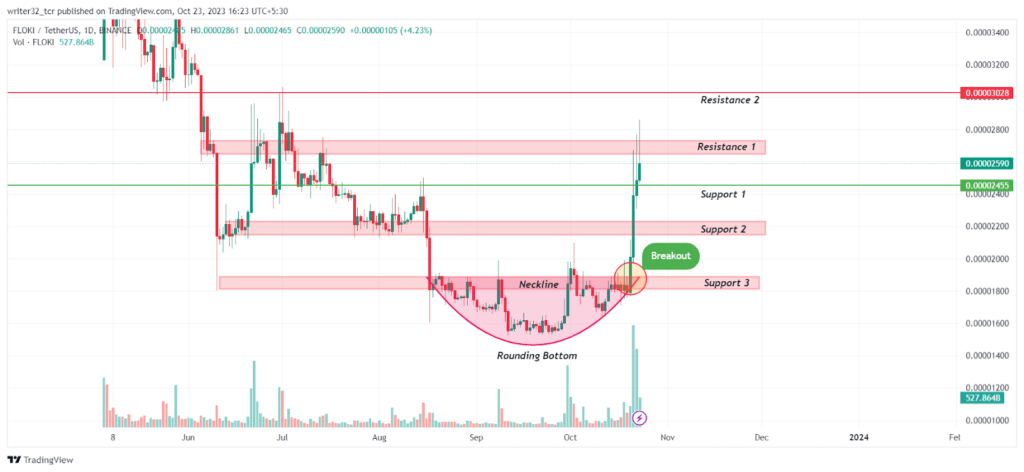
- Its price made a rounding bottom pattern in the daily timeframe.
- The token’s price got an immense surge of 60% within a week.
The token recorded a high of $0.0000540 after getting listed on binance in the month of May. It got bearish after making the high and fell to the downward level of $0.0000153 which is a support level for the price. The price then made a rounding bottom pattern in the daily timeframe and last week it gave a breakout from the neckline of the rounding bottom and got bullish.
The bulls are still trying to push the price but they are losing their dominance on the bearish investors and the price may come down now. The price is presently trading above the 50-day EMA.


The token marked an all-time high of $0.0003437 on 4th November 2021. It is almost 92.52% down from its all-time high bringing it at a price of $0.0000260. The market cap of the token during the high was at $483.94 Million.
The daily trading volume of the token has dropped by approx 40% in the last 24 hours. The total circulation of the tokens is currently at 948.29 Trillion which is 48.95% of the total supply. It has a current market cap of $244.92 Million.
Sentiment Analysis
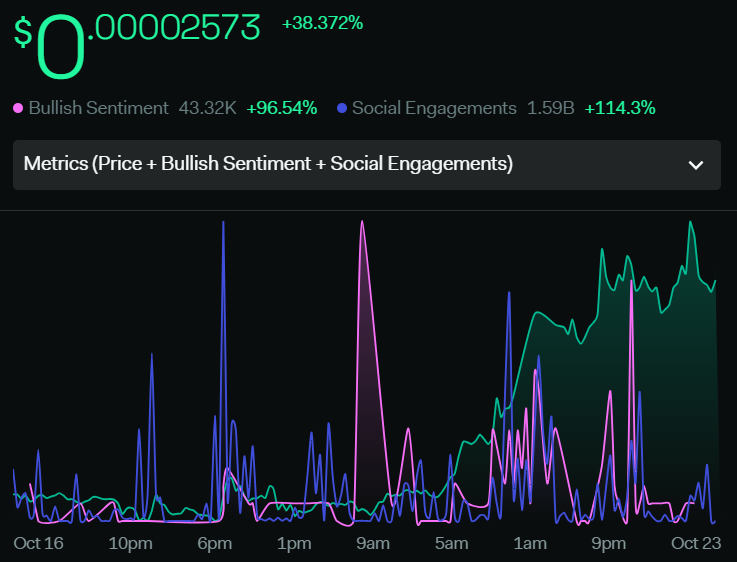
The total volume of the token has increased by 43.8% in a week which resulted in the price hike of almost 60%. The total social engagements surged by 114.3% which shows the community activity and energy in the market. Due to the price surge and the bullish activity in the market of the token the bullish sentiment metric hiked by 96.54%.
Technical Analysis Of FLOKI (Daily-1D)
After the FLOKI price gave a bullish move, The price got rejected from the resistance level of $0.0000265 to $0.0000273. The price has given a good rise and it can now come down for a correction move. Bulls may start to lose the dominance now as the volume of the token has also started to decrease.
If the volume rises from the current point and the bulls kept on pushing the price upward then it can break the resistance level of $0.0000265 and $0.0000273 and reach $0.0000300 level or further.
However, If the price loses the support level of $0.0000245, then the next support level is at $0.0000215 to $0.0000223. Also, If the bearish investors came in the dominance, then price can fall further to the levels of $0.0000188.
Indicators On The Price Of FLOKI
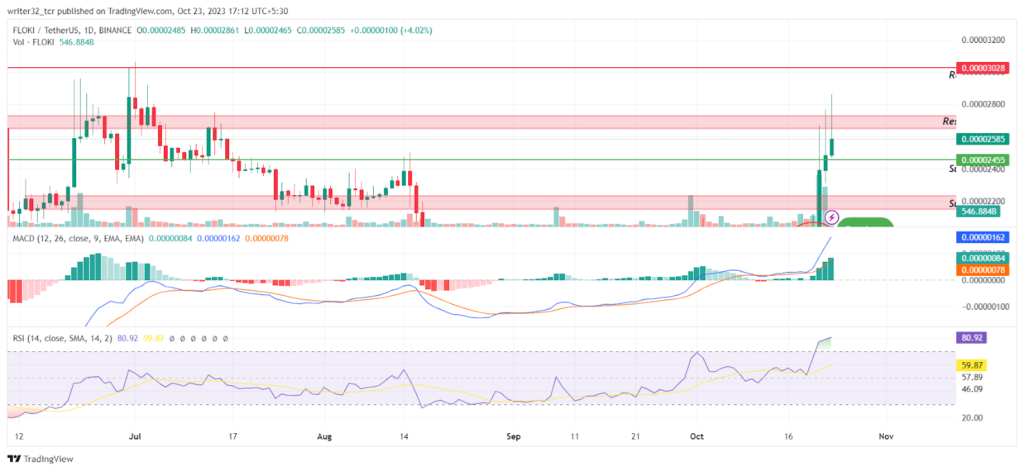
Relative Strength Index (RSI)
The RSI line is moving at 80.92 points and the SMA 14 at 59.87 points. Both are above the neutral level. The RSI has entered the oversold region and the selling pressure can be made on buyers soon.
Moving Average Convergence/Divergence (MACD)
The fast blue line moving average is moving above from the red slow line moving average. The histogram is showing a significant uptrend of the volumes which is a sign of a bullish move.
FLOKI LIVE CHART
Conclusion
The overall analysis of FLOKI price indicates that price can come down for a correction move. The volume has started to decrease and the price has also entered the overbought region. Its price may rise further if the volume starts increasing again and bulls keep their dominance.
Technical Levels
- Support Level: $0.0000245, $0.0000215 to $0.0000223 and $0.0000188.
- Resistance Level: $0.0000265 and $0.0000273 and $0.0000302
Disclaimer:
The views and opinions stated by the author, or any people named in this article, are for informational purposes only and do not establish financial, investment, or other advice. Investing in or trading crypto assets comes with a risk of financial loss.


