

- The TRB coin is presently trading at $96.00 while witnessing an upsurge of 12.66% in the intraday session.
- The price of the token almost doubled in a week.
- It is currently moving above the 20, 50, 100, 200 day EMAs.
The TRB token has recorded an immense positive ROI of 692.49% in the last 3 months and 172.16% in the last 1 month. When Bitcoin started its rally almost all the tokens started to show green signals of bullish trends. The TRB token was one of them. Its price was trading at $56 until it started a bullish rally. The price gave a massive bullish move and the price touched the $110 mark by giving 2x returns.
TRB coin’s price is presently facing rejection from the resistance level of $100 as people have started to exit from their entries. The bears might soon enter the market to push the price down.


The token marked an all-time high of $163.76 on 10 May 2021. It is only 41.52% down from its all-time high, bringing it to a price of $102. The market cap of the token during the high was at $237.60 Million.
The daily trading volume of the token has dropped by 30.33% in the last 24 hours. The total circulation of the tokens is currently at 2.47 Million, which is 97.51% of the total supply. It has a current market cap of $268.07 Million, which means it has already crossed its all-time high market cap.
Sentiment Analysis
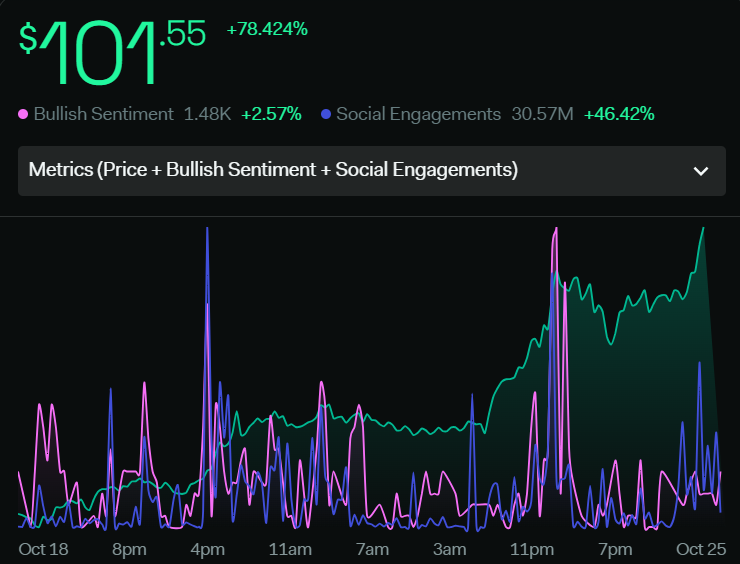
The total volume of the token has increased by 109.4% within a week. Social engagements surged by 46.42% and the total bullish sentiments have grown by 2.57%. Overall sentiments are indicating a bullish trend of the token as all the metrics are showing a positive sign.
Technical Analysis Of the TRB Cion (4 Hr)
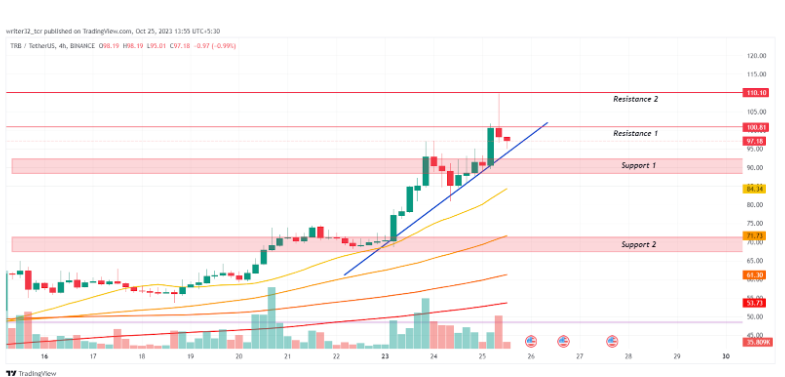
The TRB coin price is also moving on a bullish trendline in the 4-hour timeframe. It is currently getting rejected from the resistance level of $100. The price can take support from the trendline and move up again. If the price deviates below the trendline, it can take support from the $88 level to the $92 level and again make a new high.
However, If the price breaks below the trendline and the support level of $88 to $92, it might start falling again and reach a downward support level of $67 to $71. The TRB coin price can also take support from the 50-day EMA.
Indicators On The Price Of TRB
Relative Strength Index (RSI)
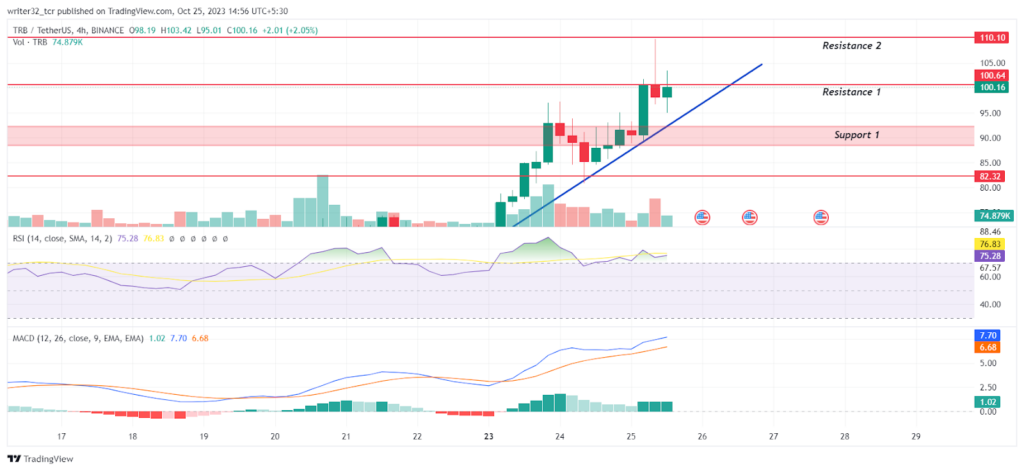
The RSI line is moving at 75.28 points and the SMA 14 at 76.83 points. Both are above the neutral level. The RSI has entered the oversold region. The selling pressure may increase on buyers as soon as the volume starts falling.
Moving Average Convergence/Divergence (MACD)
The fast blue line moving average is moving above the red slow line moving average. The histogram shows significant increases in the volumes, which indicates that the token is moving bullish. As soon as the volume starts significantly decreasing the price will start coming down.
TRB LIVE CHART
Conclusion
The market structure and the analysis of the TRB price show that it is presently under a bullish trend and moving on a trendline. If it continues to move on the trendline, the token’s price might rise further. Suppose it breaks the trendline and gets below the support zone of $88 to $92, the TRB coin’s price can get bearish.
Technical Levels
- Support Level: $88 to $92 and $67 to $71
- Resistance Level: $100 and $110
Disclaimer:
The views and opinions stated by the author, or any people named in this article, are for informational purposes only and do not establish financial, investment, or other advice. Investing in or trading crypto assets comes with a risk of financial loss.


