

- The Velas Token price has surged by over 135% in a month.
- It has given a breakout of a descending triangle pattern.
- The current market price of the VLX token is $0.017066.
In the initial phase of trading, the Velas token price has shown remarkable growth on the upside. It has surged by over 1400% from the lows and created an all-time high of $0.572 on November 4, 2023.
From the higher level, the token price started to decline and it has shown a massive fall of over 97%. The token price reached a low of $0.005188 on September 3, 2023, just before the upside rally.


At the beginning of November, the token price witnessed a sharp upward move, as it showed a surge of over 135% from the lows. It has witnessed immense buying pressure from the bulls.
In the current trading session, the token price is trading at the price of $0.016926 with a surge of 3.18%. The price is forming a green candle after forming two bearish candles on the daily chart.
Can The Velas Token Price Reach the $0.03000 Level in 2023?
The VLX token price has given a breakout of the descending triangle pattern on the daily chart. Coin’s price reacted sharply after that, as the price showed a jump of over 147% from the breakout level.
The VLX token price is inching closer to the resistance level of $0.018896 and recently has faced a sharp rejection from that level. The bulls have challenged the bears and it seems like there is a tough battle going on near the resistance price.

If the token price breaks the $0.018896 level, it can try to move towards the level of $0.023613. Furthermore, the bulls are looking stronger at the present level and it seems possible for the bulls to break the resistance.
The token price during the surge has breached the important resistance level of $0.010750. It can now act as support for the price. Apart from that, the other support for the price is present near the $0.005941 level.
What Do the EMAs and RSI Indicate About the VLX Token Price?
Recently, the GLX token price has regained the 50-day and 200-day exponential moving average (EMA). The slope of the 50-day EMA is inching closer to the 200-day EMA. It indicates that the price can witness a golden crossover soon.
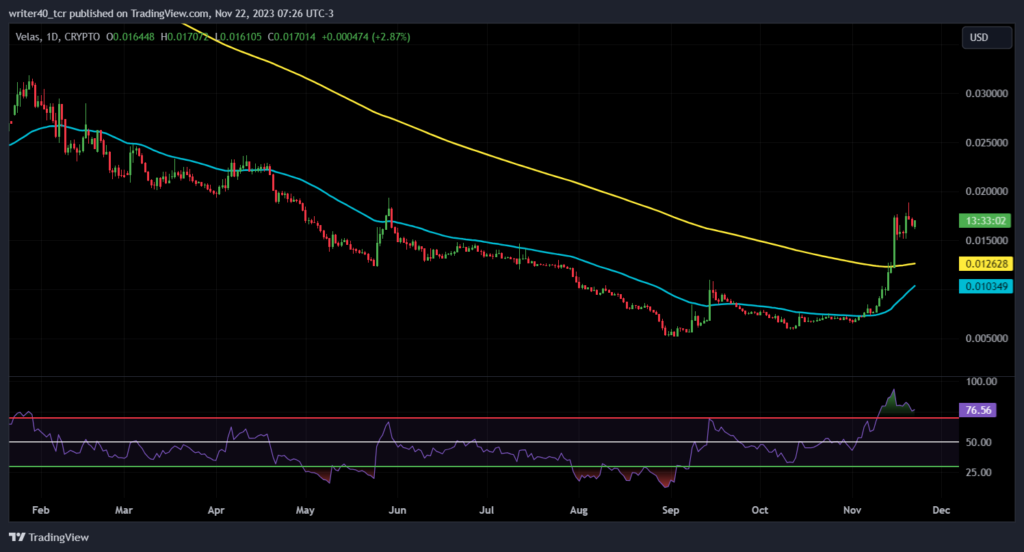
The relative strength index (RSI) is curving at 76.56, which shows the price is in an overbought trajectory. Now, the slope of the RSI is down and that shows the bulls are losing momentum.
Conclusion
In recent times, the VLX token price has shown a strong upsurge and the price is in a bullish momentum. The token price is trading close to the resistance level and is looking strong. The bulls can try to clear out this resistance in the future.
Technical level
Resistance level – $0.018896 and $0.023613
Support level – $0.010750 and $0.005941
Disclaimer
The views and opinions stated by the author, or any people named in this article, are for informational purposes only. They do not establish financial, investment, or other advice. Investing in or trading crypto assets comes with a risk of financial loss.


