

- The Ethereum crypto has witnessed a huge increase in the trading volume.
- In just the last 24 hours, the price of Ethereum has lost its value by 7.1%.

Ethereum is a blockchain platform that enables smart contracts and dApps. ETH is its native cryptocurrency and it has various uses and value.
Ethereum supports various applications, tokens, and communities. The Merge was a key upgrade that switched Ethereum to a Proof-of-Stake (PoS) consensus mechanism, improving its efficiency, security, scalability, decentralization, and evolution.


The derivatives trading volume of the Ethereum crypto has increased by 127.16% in the last 24 hours and the spot trading volume has also witnessed an increase of 93%.
The market cap of the Ethereum crypto has declined by 6.8% resulting in a value of $267.698 Billion. Additionally, the open interest of the crypto has declined by 8.3% along with a decline of 51.5% in the options volume.
The current derivatives traded volume value of the Ethereum crypto in the last 24 hours is $29.39 Billion while the spot volume value is $14.49 Billion. The current volume/market cap ratio of the crypto is 5.14%.
The current open interest of the ETH crypto is $7.95 Billion and the long/short ratio of the crypto is 0.9073. Ethereum has faced a long liquidation of $68.27 Million against the short liquidation of $6.53 Million in the last 24 hours.
Ethereum Blockchain Data
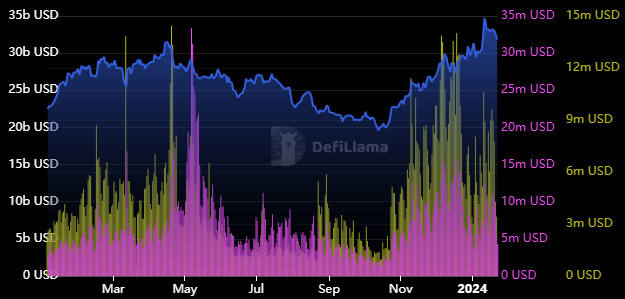
The fees collected by Ethereum in the last 24 hours, as per DefliLlama, is $4.26 Million and the stablecoin market cap of the crypto is $69.292 Billion. Moreover, the crypto made a revenue of $3.43 Million and the fully diluted market cap of the crypto is $267.314 Billion.
Moreover, the circulating supply of the crypto is 120.178 Million ETH and the max supply is infinite.
ETH Crypto Technical Analysis
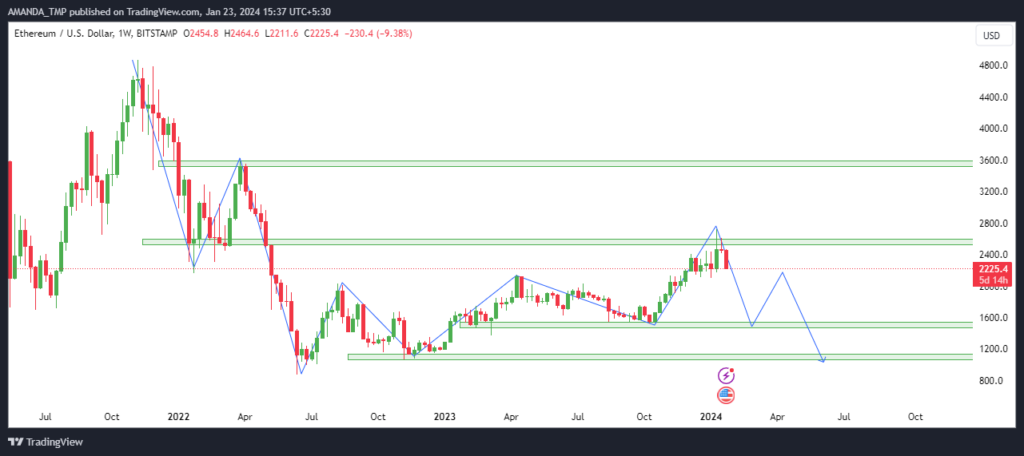
At a very crucial swing high of $2730.00, the ETH crypto price is taking resistance and is witnessing a decline in the trading price. Moreover, the price of the crypto has formed an evening star pattern, indicating the possibility of a further decline in the price.
ETH/USD Chart by TradingView
The EMAs such as the 20, 50 and the 200-day EMAs are forming a golden cross while the price seems to be telling a different story. The price of the Ethereum crypto has declined below the 20-day and the 50-day EMAs.
The signal line is situated below the MACD line on the daily chart of the crypto, forming red histograms on the chart, indicating a bearish trend on the chart.
The RSI for the ETH crypto is consistently declining and is currently situated at a level of 39.88, indicating a decline in the price momentum.
Summary
Ethereum is a leading blockchain platform with many features and use cases. However, its price is facing a strong downtrend and has formed a bearish pattern. The indicators are also showing weakness and the volume/market cap ratio is low. The price of the Ethereum crypto may continue to decline unless it breaks above the resistance level.
Disclaimer
The views and opinions stated by the author or any other person named in this article, are for informational purposes only and do not constitute financial, investment, or other advice. Investing in or trading crypto or stocks comes with a risk of financial loss.


