

- As per CoinCodex, the market sentiment for the Ethereum crypto is bullish.
- In the last 24 hours, the ETH price has increased by 1.78%.
Ethereum is a blockchain platform that enables smart contracts and decentralized applications. It has its own cryptocurrency, Ether, which powers the network. Ethereum is used for various purposes, such as DeFi, NFTs, and DAOs. Ethereum recently upgraded to a more efficient and secure consensus mechanism, and the upgrade was called The Merge.
With a volume/market cap ratio of 2.88%, the current market market cap of the Ethereum crypto is $277.648 Billion. This market cap results in a market cap dominance of 16.78% in the global cryptocurrency market.


Ethereum is the second-largest cryptocurrency for which the value of the traded volume in the last 24 hours is $7.912 Billion and it has a circulating supply of 120.182 Million ETH. Additionally, its maximum supply is infinite while its total supply is 120.182 Million ETH.
Ethereum has a fully diluted market cap of $277.712 Billion and the supply inflation of the crypto is low at -1.79%. It was released on July 30, 2015 and it has a stablecoin market cap of $69.803 Billion.
Ethereum Derivatives Analysis

The open interest of the derivatives of the Ethereum crypto have witnessed a flat change in the last 24 hours while the derivatives volume has declined by 33.56% to $12.98 Billion. Additionally, the options volume has witnessed a decline of 51.5% and it has a traded volume of $320.63 Million.
The long/short ratio of the crypto is 1.006 and it has witnessed a long liquidation of $5.07 Million. Additionally, the recorded short liquidation for the crypto in the last 24 hours is $9.10 Million.
ETH Crypto Technical Analysis

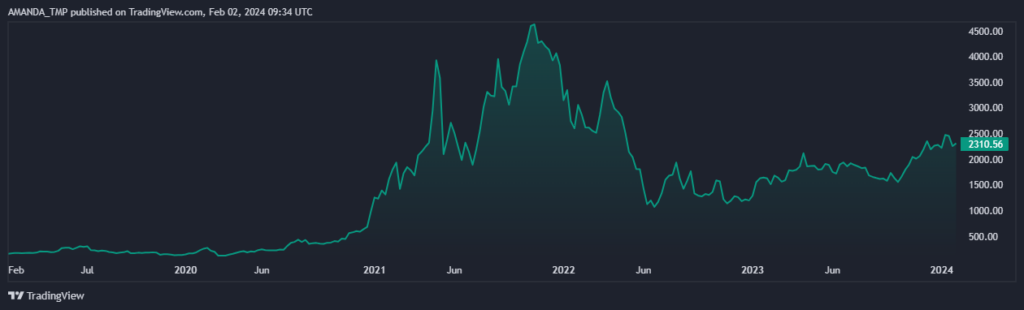
The ETH crypto price is slowly rising to higher levels and it is forming a rising wedge pattern. Furthermore, the price of the crypto has broken out above the pattern and is currently hovering around the breakout levels.
If the price of the crypto also breaks above the last swing high, the price might continue to surge to higher levels.
ETH/USD Chart by TradingView
Crucial EMAs such as the 50-day and the 200-day EMAs are forming a golden cross while the ETH crypto is trading between both the EMAs. If the price of the crypto rebounds above the 50-day EMA, the probability of a surge in the price will increase.
The MACD and the signal lines have declined below the zero level and there is the formation of bearish histograms on the chart. This behavior of the indicator represents a weakness in the price.
The RSI has declined below the 50-level from the overbought zones and it has overlapped with the 14-day SMA. If the RSI rebounds above the 50-level, a further rise in the price can be witnessed.
Summary
Ethereum is a leading blockchain platform with a strong market cap and dominance. It has been upgraded in an event called The Merge to a more efficient and secure consensus mechanism. Ethereum’s price is breaking out of a rising wedge pattern and could surge to new highs if it crosses the last swing high.
Disclaimer
This article is for informational purposes only and does not provide any financial, investment, or other advice. The author or any people mentioned in this article are not responsible for any financial loss that may occur from investing in or trading. Please do your research before making any financial decisions.


