

- The Bitcoin crypto is trading 63000% above its all-time low price point.
- The BTC crypto has a medium volatility of 4.15%, as per CoinCodex.

Bitcoin is a decentralized cryptocurrency that uses blockchain technology to secure and verify transactions. It was created by the pseudonymous entity Satoshi Nakamoto in 2008 and it has a limited supply of 21 million coins. Bitcoin can be used for various purposes including payments, investments, or as a store of value.
The market cap of Bitcoin has increased by 2.03% in the last 24 hours and its market cap value is $843.297 Billion. Bitcoin is the cryptocurrency in the world with the highest market cap.


The traded volume value of the crypto in the last 24 hours is $19.834 Billion, which has witnessed a decline of 23.5% and the volume/market cap ratio of the crypto is 2.30%.
Bitcoin has a medium supply inflation and the dominance of the crypto alone is 50.77%. Moreover, the volatility of the crypto is medium at 4.15%, as per CoinCodex.
The derivatives trading volume of Bitcoin also has witnessed a decline of 26.5% while the open interest has increased by 3.04%. The options volume of the crypto has further witnessed a decline of 39.7% and the long/short ratio of the crypto is 1.03.
Moreover, the crypto has faced a long liquidation of $8.21 Million against the short liquidation of $17.31 Million.
Bitcoin Blockchain Data Overview

The total supply of Bitcoin is 19.615 Million BTC while the max supply is 21.0 Million BTC. Additionally, the fully diluted market cap of the crypto is $903.281 Billion and it has a Total Value Locked of $305.7 Million.
BTC Crypto Technical Analysis
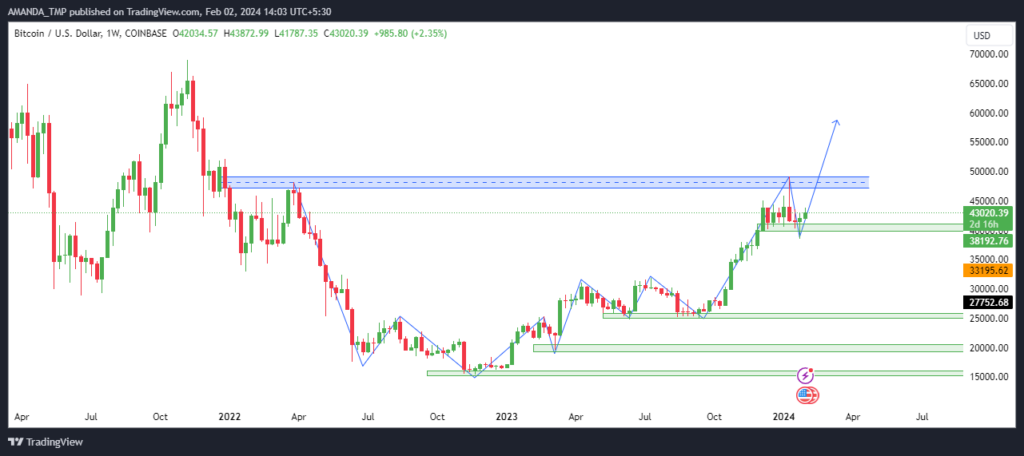
The BTC crypto price is making a higher high swing structure on the weekly chart of and it is consistently rising to higher levels. The price has witnessed a strong resistance at the higher resistance level.
If the BTC price manages to break above the recent swing high, a further surge in the price can be witnessed in the future.
BTC/USD Chart by TradingView
The 20, 50 and 200-day moving averages are forming a golden cross and the price of the crypto is also above the EMAs.
The MACD and the signal lines are forming a golden cross as the MACD line is situated above the signal line and is rising towards the zero level. It also forms a bullish histogram on the chart.
The RSI is situated above the 50-level and is following a bullish cycle. It has crossed above the 14-day SMA. This represents the bullish momentum of the BTC price.
Summary
Bitcoin is the leading cryptocurrency with a strong market cap and dominance. It is trading above its moving averages and has a bullish momentum at the moment. If it breaks above the recent high, it could surge to new levels.
Disclaimer
This article is for informational purposes only and does not provide any financial, investment, or other advice. The author or any people mentioned in this article are not responsible for any financial loss that may occur from investing in or trading. Please do your research before making any financial decisions.


