

- The yearly inflation rate of Litecoin is high at 3.46%.
- Out of the last 30 days, the LTC crypto has shown 16 green trading days.

Litecoin is a fork of Bitcoin that offers faster and cheaper transactions. It was created by Charlie Lee, a former Google engineer, who now leads the Litecoin Foundation. Litecoin has a finite supply of 84 million LTC and uses Proof-of-Work mining. It also tests new technologies like SegWit and Lightning Network.
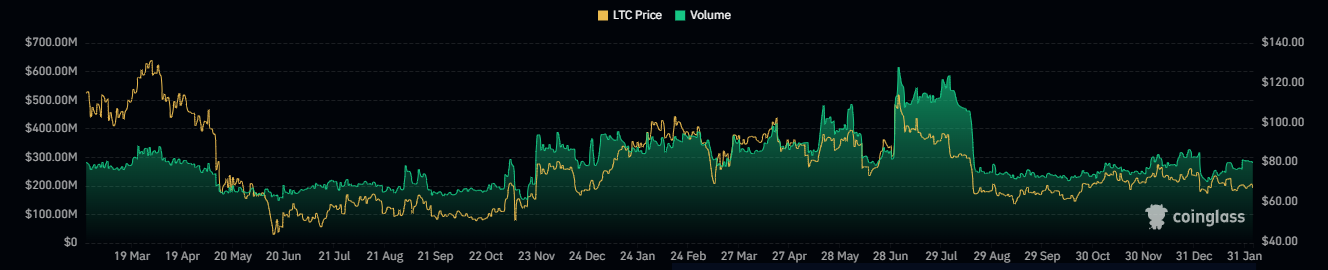
The market cap of Litecoin has not witnessed any significant change and the trading volume came up to $200.57 Million in the last 24 hours. Additionally, the market cap ranking of the crypto is 19th.


The volume/market cap ratio of the crypto is 2.94% while the circulating supply is 74.171 Million LTC. Moreover, the total supply of the crypto is 84.0 Million LTC and the fully diluted market cap is $5.703 Billion.
The supply inflation of the crypto is 3.46% and its market cap dominance is 0.30%. Moreover, the volatility of the crypto is 3.28%, which is medium, and the fear and greed index of the crypto is 60, as per Coincodex.
Litecoin Crypto Derivatives Analysis
The long/short ratio of the crypto is 0.9421 and the derivatives trading volume of the crypto has declined by 4.8%. Furthermore, there has been an increase of 3.6% in the last 24 hours.
The long/short ratio of the crypto is 0.9421 and the long liquidation of the crypto is $233.0K against the short liquidation of $6.02K. This shows that sellers have been dominant over the price in the last 24 hours.
LTC Crypto Technical Analysis
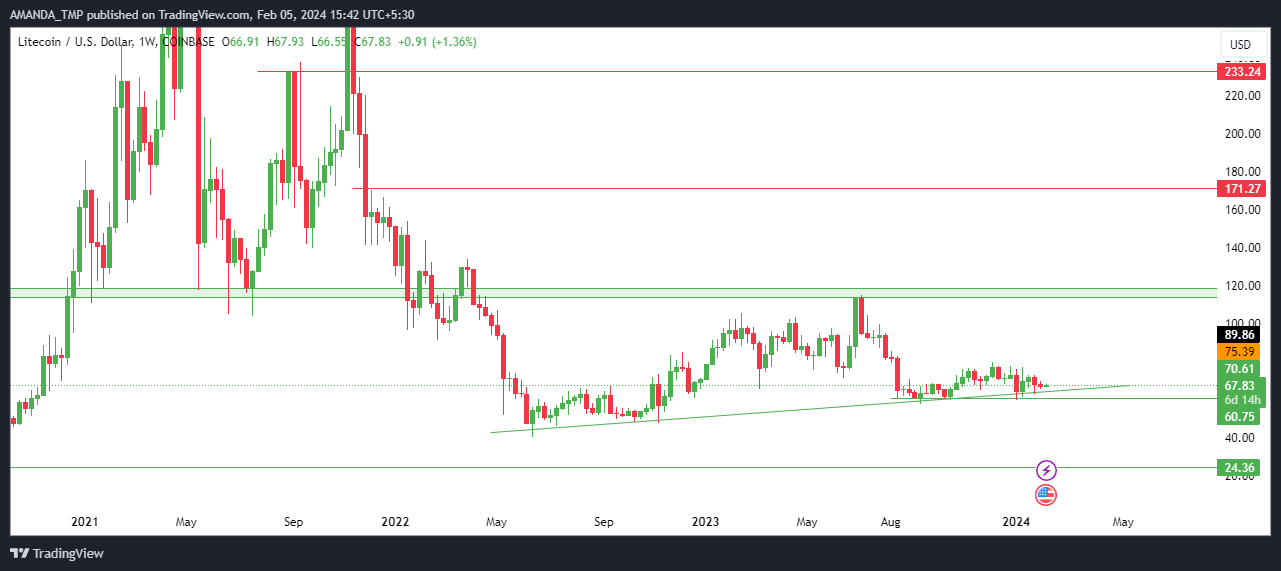
The LTC crypto price is sustaining on a dynamic trendline but the trend is still bearish and the price might continue to decline to further lows.
Despite this, the price of the crypto has formed a strong resistance at higher levels and if the price breaks above the resistance level with strong momentum, a change in the trend can be seen.
LTC/USD Chart by TradingView.com
The popularly known EMAs such as the 20, 50, and 200-day EMAs are forming a death cross and the price of the crypto is sustaining below these EMAs. This indicates a strong downtrend in the price.
The MACD and the signal lines are also situated below the zero level and are forming uncertain histogram blocks. This behavior of the crypto represents uncertainty in the price.
The RSI has been consolidating within a narrow range, oscillating around the 50-level and points to bearish momentum.
Summary
Litecoin is a fork of Bitcoin that has high inflation and low market cap. It is facing strong resistance and bearish pressure from sellers. The technical indicators show a downtrend and uncertainty. The LTC price is likely to drop further unless it breaks below the dynamic support.
Disclaimer
This article is for informational purposes only and does not provide any financial, investment, or other advice. The author or any people mentioned in this article are not responsible for any financial loss that may occur from investing in or trading. Please do your research before making any financial decisions.


