

- The GMX coin price moved more than 30% in the last seven days.
- The technical indicators are indicating a sign of a bullish reversal.
GMX is a decentralized exchange (DEX) primarily launched in September 2021 as a Gambit Exchange. The platform provides 50x leverage on popular cryptocurrencies like BTC, ETH, and more. GMX is a leading derivatives DEX on Arbitrum and Avalanche with a total trading volume of over $130 Billion and 283K real users.
Six months Remained Positive for the GMX Coin Price
The GMX coin price has delivered a return of 40% in the last six months. It has recently attracted investors by showing positive returns from the crucial levels. After a strong bullish reaction, the price started its bullish reversal journey in August 2023.


Subsequently, the GMX coin price took two and a half months to break above the $44.53 resistance level. The price formed an inverted head and shoulders pattern on the $31.51 support level, which became a strong sign of reversal.
GMX coin price surged more than 40% from the $44.53 breakout level. It reached the $65.32 resistance level and made a bullish correction on the breakout level. As a result, the price again surged from this level but failed to close above $65.32.
Consequently, the price fell below the $44.53 support level, but the buyers showed up and are leading the price upward. Currently, the 24-hour trading volume and the market capitalization of GMX are ranked 165th and 137th among all cryptocurrencies.
Technical Analysis of the GMX Coin Price
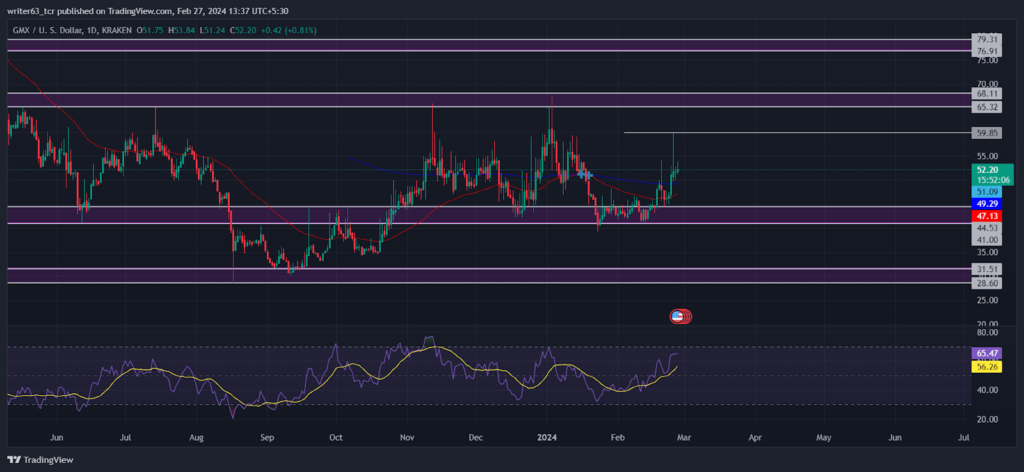
The GMX coin price has recently rebounded by the 50-day and the 200-day EMAs, indicating a bullish reversal. The price is also increasing above the bearish crossover point at $51.09.
GMX coin price has gotten a bullish response from the $41.00 support level. Previously, the buyers were aware of the particular breakout level of the inverted head and shoulders pattern. The current bullish rally is a consequence of that breakout.
At press time, the price is moving toward the $65.32 resistance level even though it got a rejection from the $59.85 level. Regarding the technicals, it may give a breakout of the $65.32 resistance level.
Furthermore, the relative strength index (RSI) slope has already shown an internal bullish divergence. It is indicating the buyers are in charge of the current momentum. The RSI is sloping toward the 70-mark upper band.
Conclusion
Lastly, the GMX coin price is showing solid signs of a bullish reversal. Earlier, the price was given a breakout from an inverted head and shoulders pattern. The current price is taking that breakout level as a demand zone for a bullish rally. As per the price action, the GMX coin price may soon complete the $65.32 hurdle. However, a shortfall can be seen if the price closes below the $41.00 level.
Technical Levels
- Resistance Levels: $65.32 and $79.31
- Support Levels: $41.00 and $28.60
Disclaimer
The views and opinions stated by the author, or any people named in this article, are for informational purposes only. They do not establish financial, investment, or other advice. Investing in or trading stocks and crypto comes with a risk of financial loss.


