
 Pearl
Pearl Starknet
 Quantus
 Sui
Sui NEAR Protocol
 Pudgy Penguins
 Lighter
- The Helium price faced resistance from the $6 mark and lost around 26% in a few days.
- This cryptocurrency’s trading volume has decreased by 25% in the past 24 hours.
After a bullish trend, the HNT price tried many times to sustain the $10 mark. It failed to do so and displayed a bearish trend. During this fall, the bearish trend interrupted near the $3.50 hurdle and bounced back. Buyers tried to gain bullish momentum, but the Helium crypto price faced resistance from $6 and reacted negatively.
The HNT crypto price has triggered a negative pullback and has dropped below the 200-day exponential moving average. It has retested the 20-day exponential moving average and lost about 6% in a few hours.
Helium Wallet App v2.7.8: Important Update
Important Update: Helium Wallet App v2.7.8 (Android & iOS)
— Helium (@helium) May 14, 2024
The v2.7.8 release addresses some community reported issues. Specifically, there were some issues loading items in the Collectables tab and claims on delegated positions were having issues when older than 180 days.… pic.twitter.com/d0FwLPzceq
Based on the source on X, under this update, there were some issues loading items in the collectible tab and claims of delegated positions having issues when older than 180 days. These issues are fixed now.
HNT Price Prediction: Will Helium Crypto Price Bounce Back?
The HNT Crypto chart structure shows that the price has been performing negatively since March. Recently, the asset price has triggered a negative pullback and is heading for the last swing low.
As we can see on the chart, the price has slipped below the key moving averages. If the buyers aren’t involved, then the price may drop to the support level of $3.50 in a few days.
Assuming the HNT price fails to defend the $3.60 mark, the sellers may drag it down to the major support level of $2. On the other hand, if the price bounces back and exceeds the key moving average, buyers may be eyeing a new all-time high.
MACD shows that the histograms have turned red, and a death crossover has been generated between the MACD and the Signal line. According to the Bollinger Band (BB), the price has dropped below the basis line and has been retested. It may drop to the lower line as the trend is bearish.
Helium Price Analysis Over 4-H Timeframe
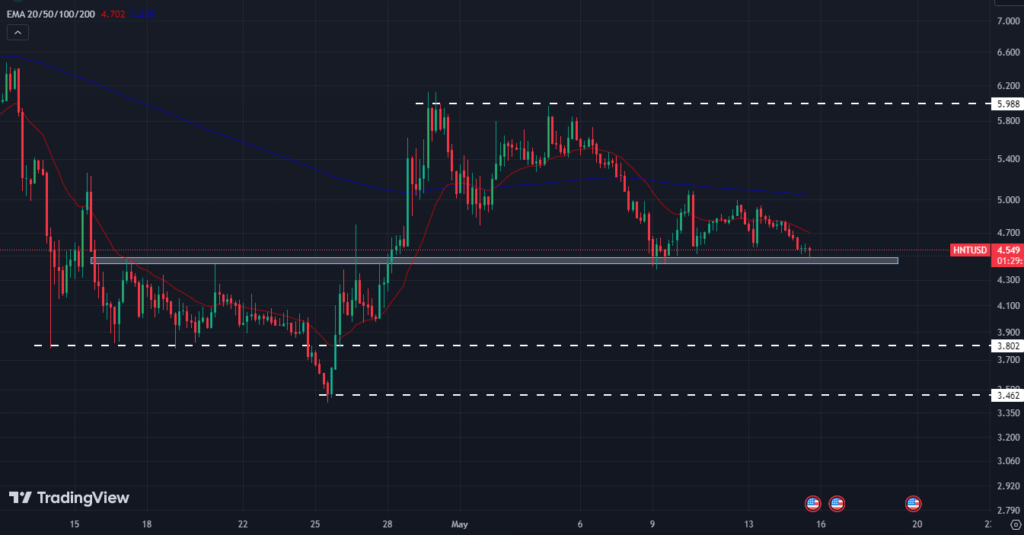
At press time, the Helium price traded at $4.57, up by 0.22% in the past 24 hours. The market capitalization is $734.91 Million, and the 24-hour trading volume is $6.04 Million. The circulating supply is 160,875,442 HNT, and the fully diluted market cap is $1.01 Billion.
HNT price has been taking support on the $4.50 level for the last few days. At the time of writing, a hammer candlestick pattern formed on the support level. Suppose the asset price starts trading below the $4.50 level, and then it may melt to the significant support level of $3.75.
On the contrary, if the Helium price takes support on the major support level and trading volume increases, the price may extend to the 200-day exponential moving average. If the price advances the key moving average and sustains, it may turn into a trend reversal.
Conclusion
The HNT price is currently facing some challenges, with a potential for further downward movement if it fails to defend the support levels. However, if the price finds support and the trading volume increases, there may be a chance for a trend reversal. Moving averages can play an essential role in supporting and resisting levels.
Technical Levels
The Helium crypto price may take support on the $4.50 and 3.80 levels as per the technical chart. If the momentum turns bullish, the price rally can be interrupted near the $6 and $10 marks.
Disclaimer
This article is for informational purposes only and provides no financial, investment, or other advice. The author or any people mentioned in this article are not responsible for any financial loss that may occur from investing in or trading. Please do your research before making any financial decisions.




