

- A decrease of 4.63% has been observed in the Ethereum price during the weekly trading session.
- The all-time high price level of the ETH crypto stands at the $4891.70 level.
- The trading volume of ETH faced an 11.96% decline in the last 24 hours.
Ethereum (ETH) is an open-source, decentralized blockchain that has become a global platform for decentralized applications (DApps). It is a base layer for numerous other cryptocurrencies and for the execution of smart contracts. The platform allows users to write and run software resistant to downtime, censorship, and fraud.
Ethereum May 2024, Supply Changes, Valuations & Distribution
The full diluted market capitalization of ETH tokens is assumed to be at $358.35 billion, which is also the current market cap. The cryptocurrency has over 120 million ETH tokens, which are currently circulating in the market. Ethereum has a dominance ranking 2nd to Bitcoin (BTC) out of 9,867 active cryptocurrencies.


Regarding trading volume, the ETH tokens have reached $16.85 billion in the last 24 hours. It ranks under the top five most traded cryptocurrencies in the current phase. The volume-to-market cap ratio (VMR) is 4.70%, reflecting sufficient liquidity in popular exchanges like Binance, Coinbase, Curve, Bybit, OKX, etc.
The initial distribution of the ETH tokens is categorized into two parts: allocation of 83.33% to the crowd sale, and the remaining 16.67% is preserved for the Foundation, early contributors, and others. Additionally, Crypto whales own 28.17% of the overall circulation supply, and 71.83% remains for other wallets.
Price to Volume and Social Dominance Analysis
The social rise in tweets about the Ethereum crypto has always played a significant role in positively impacting the price. In early Feb 2024, the social rise in tweets covered over 9%, which became one of the main reasons behind the upsurge in ETH crypto price. However, social dominance is rising in the current sessions, but the price is experiencing constant declines. The current social dominance has reached 8.79%.
Technical Analysis of the Ethereum (ETH/USD)
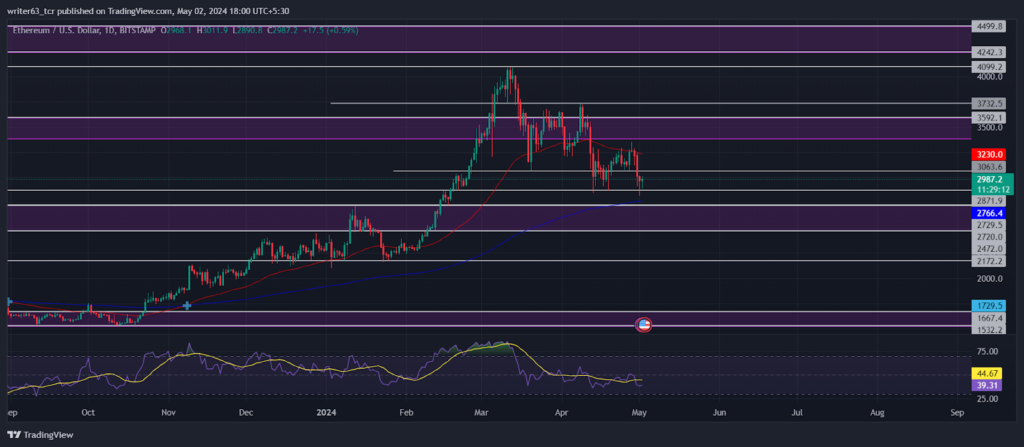
The long-term outlook lies above the key exponential moving averages on the bullish side. The current price slipped between the 50-day and 200-day EMAs, indicating uncertainty in the short-term trend.
ETH price is facing constant declines from the $4099.2 resistance level. The crypto price is having a major bullish correction period. The current price is sustaining above the $2729.5 demand zone. Regarding the technicals, the ETH price may reach the $2720.0 level before any upsurge. For the bullish view, the price should break above the $3592.1 level.
The relative strength index (RSI) line is moving in correlation with the spot price chart, indicating a neutral perspective. The death crossover between the RSI and SMA line boosts bearish momentum.
Summary
The Ethereum price has been experiencing a major bullish correction period since March 12, 2024. Crypto has reported over 15% negative profitability during the monthly trading session. The price is sustaining above the $2729.5 demand zone at press time. Regarding the technicals, the ETH price may reach the $2720.0 level before any upsurge. For the bullish view, the price should break above the $3592.1 level.
Technical Levels
- Resistance Levels: $3732.5 and $4099.2
- Support Levels: $2720.0 and $2472.0
Disclaimer
The views and opinions stated by the author or any people named in this article are for informational purposes only. They do not establish financial, investment, or any other advice. Investing in or trading crypto or stock comes with a risk of financial loss.


