
- The Fetch.ai (FET) price took support on the 100-day EMA mark and looks neutral.
- Sellers are eyeing to push the token toward the $2 mark.
The Fetch.ai (FET) token price sustained above the $2 mark and is close to the trendline support mark of the ascending triangle pattern on the charts.
Last month, the FET token faced rejection from the resistance mark of $3 and erased over 22% of gains. Currently, the token has taken the support on the 100-day EMA mark and is trying to save the $2 mark to avoid any upcoming selloff.


Meanwhile, the trend looks neutral and indecisive in price movements, conveying signs of correction in the next sessions.
At press time, the Fetch.ai (FET) price traded at $2.25 with an intraday drop of 1.28%, reflecting neutrality on the charts. It has a monthly return ratio of 3.20% and 712.30% yearly.
The pair of FET/BTC is at 0.0000329 BTC, and the market cap is $5.80 Billion. Analysts are neutral and suggest that the Fetch.ai price may register a negative move and will lose the gains in the next sessions.
Could FET Price Slip To $2 Mark Ahead?
The daily charts of the FET token form an ascending triangle pattern, and the token trades close to the crucial trendline support around the 100-day EMA mark.
Moreover, the trend is shifting toward the bears, hinting at an upcoming selloff possibility.
Analyst Crypto Tony says that $2.57 is the level to reclaim by the bulls to gain momentum ahead. Below that, the FET price action is not suited for any long-side trades.
$FET / $USD – Update
— Crypto Tony (@CryptoTony__) May 29, 2024
$2.57 is the level to reclaim before we see another safer entry here. pic.twitter.com/g3TqWli1LW
Source: X
The FET price remained in a range for the month and a half. It did not reveal any significant changes, conveying that investors were losing their confidence and had found better trading opportunities in other altcoins.
For the last sessions, a decline in the trading volume was noted, conveying a decrease in the buying interest.
Source: Santiment
If the FET token slips below the $2 mark, an aggressive selloff will occur, and the down move will be toward the 200-day EMA mark.
The RSI curve stays close to the midline region, and a positive crossover is still active in the charts.
Decline In Price Volatility and Sentiment
Following the price consolidation, the price volatility witnessed a significant decline, dropping over 12% to 0.01, revealing a drop in investor interest.
Source: Santiment
The weighted sentiment data remained negative and stayed below the midline region, signifying a negative outlook. Furthermore, the key metrics have turned red, and signs of bearishness have been noted.
What Does Social Dominance and Development Activity Data Say?
Per the Sanitment data, the social dominance data surged over 14% to 0.273%, revealing a nominal investor interest in the social platforms.
Source: Santiment
The development activity data also noted a consistent up move and stayed in the upside region, around the 19.4 mark, highlighting a positive outlook.
Futures OI Data Reveal Long Unwinding Data
The Futures Derivative data signifies the fear among the investors and indicates the long unwinding data in the intraday session.
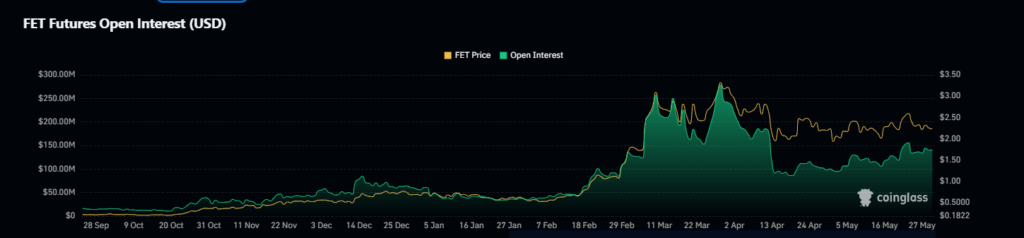
The Open interest (OI) value dropped over 6.04% to $138.02 Million in the last 24 hrs, suggesting a possible down move ahead.
Conclusion
The Fetch.ai (FET) price action signifies the decline in investor interest and is sustained at the 100-day EMA mark. Meanwhile, the token may slip toward the $2 mark if the range breaks.
Disclaimer
This article is for informational purposes only and provides no financial, investment, or other advice. The author or any people mentioned in this article are not responsible for any financial loss that may occur from investing in or trading. Please do your research before making any financial decisions.


