
 streamoors
 IGNITION
 NEAR Protocol
 Injective
 Pearl
Pearl LayerZero
 Quantus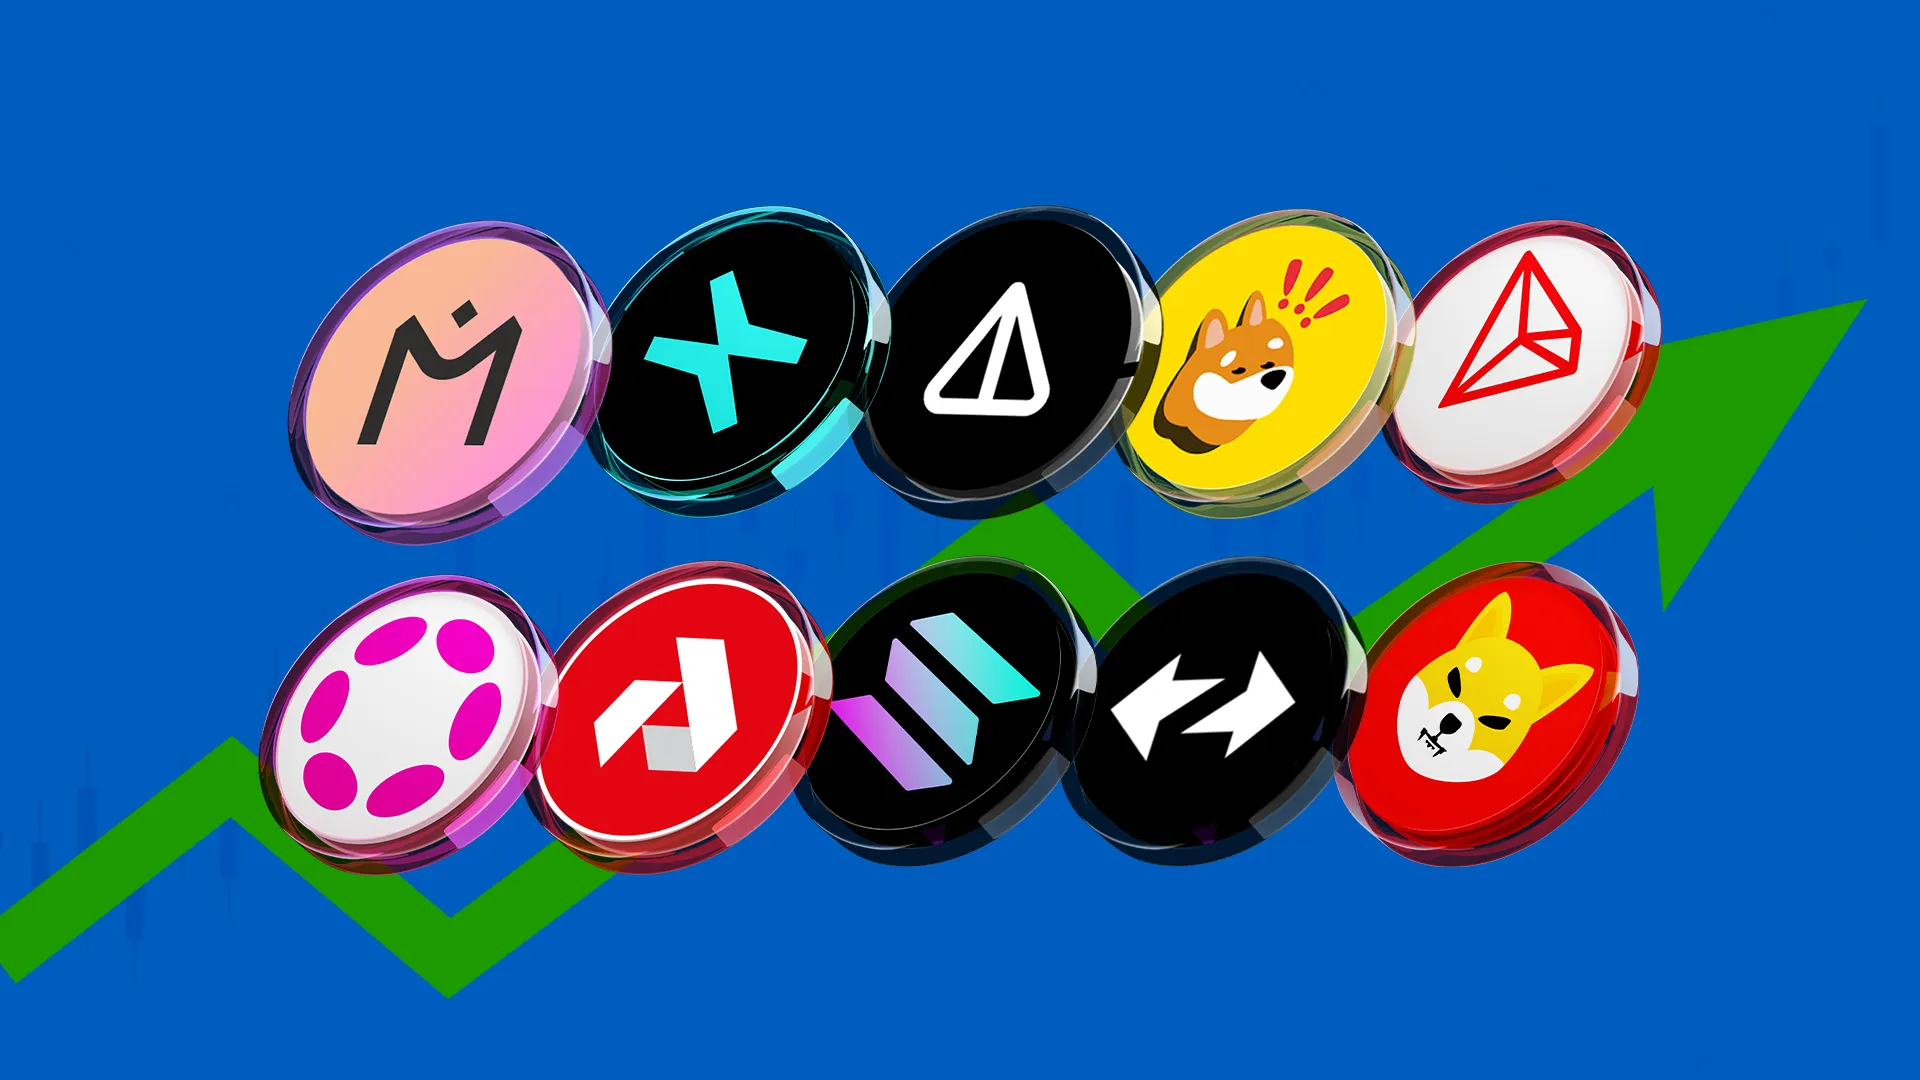
- MANTRA (OM) outperformed the most and recorded a weekly surge of over 25%.
- NOT, EGLD, and BONK were also in the row and contributed their gains this week.
The first week in July was comparatively low-key owing to the fact that many crypto assets, such as Bitcoin (BTC) and Ethereum (ETH), were in the red zone for the week.
However, some tokens like MANTRA, EGLD, and a few more remained relatively stable and demonstrated a good performance.
It is high time to remember the list of best-performing cryptos of the week as their value has gone up during the week. As per the CoinMarketCap data, MANTRA, EGLD, NOT, and BONK were at the top, while TRX, DOT, SOL, and others were also in the row.
Here’s a weekly analysis of the top ten crypto gainers.
MANTRA (OM)
OM, the native token of MANTRA, has risen by 25% and rebounded from its 100-day EMA mark this week. However, the coin was still traded in the closed range and was eyeing to cross its range trajectory of $1.
Its technicals look robust; the RSI curve stands in the overbought zone, producing a positive crossover, while the price stays in the upper Bollinger band, reflecting the optimistic outlook.
MANTRA Price Chart | Source: Santiment
At press time, MANTRA was trading at $0.9229 with an intraday surge of 8.30% and a weekly surge of 25.90%, reflecting buying momentum on the chart.
In terms of market cap, the token was ranked at 82 and has a market cap of $837.82 Million, while the total supply was noted at 966.37 Million.
MultiversX (EGLD)
MultiversX (EGLD) price escaped from weekly consolidation and climbed above the 50-day EMA mark, signifying a reversal this week.
Over the past few weeks, the token was indulged in a correction, but the bulls have managed to secure the $25 mark and led a reversal.
EGLD Price Chart | Source: Santiment
At press time, the EGLD was trading at $34.06 with an intraday surge of 5.30% and a weekly surge of over 21%, reflecting a pullback on the chart.
The EGLD token has reverted from its key support of $25 and led a sharp reversal with a huge volume spurt.
Ranked at 78 in market cap, the token has a total supply of 27.15 million, while the volume-to-market cap ratio is 0.0734.
Notcoin (NOT)
Notcoin (NOT) recorded a falling wedge pattern breakout, and a sharp follow-on buying action was noted this week.
Since June, NOT coin price has continued to retrace gains and has continued to form lower low swings, retesting the $0.01000 mark. Afterward, buyers accumulated the coin and lifted over 10% this week.
NOT Price Chart | Source: Santiment
At press time, the Notcoin was trading at $0.0152 with a sharp intraday surge of 48.30% and a weekly surge of over 10%, reflecting a breakout on the chart.
Despite the bearish market, investors are focused on Notcoin, which has resulted in a massive breakout rally in the past 48 hours.
Notcoin has a market cap of $1.56 Billion and was ranked at 56. Its key indicators conveyed a positive outlook and suggested it would continue outperforming ahead.
TRON (TRX)
Tron exhibited a double-bottom pattern breakout and sharply exceeded the neckline hurdle of $0.12800 in the last few hours.
Its price action revealed the buyers had accumulated the coin from its bottom and continued to stretch the gains. Notably, it has climbed above the key EMAs and is molding its eyes to catch the upside mark of $0.13500 shortly.
TRON Price Chart | Source: Santiment
At press time, TRON was trading at $0.130 with an intraday surge of 1.86% and a weekly surge of over 3.62%, reflecting buyer accumulation activity on the chart.
The coin has a market cap of $11.64 Billion and was ranked at 12. The RSI and MACD indicators indicated a positive crossover, implying that a sharp bullish wave could be seen ahead.
Bonk (BONK)
Bonk (BONK) has formed a double bottom around its key support of $0.00001900 and rebounded from the 200-day EMA mark this week.
Amidst the market’s bearish move, the memecoin struggled to secure the gains and hovered in the downside region.
Its price projection showed mixed cues, as it was traded in a corrective phase and noted a double top formation, which led to the selloff in the recent sessions.
If bulls continue to accumulate, the memecoin could stretch the rebound ahead.
BONK Price Chart | Source: Santiment
At press time, BONK was trading at $0.0000222 with an intraday surge of 1.06% and a weekly surge of over 1.82%, reflecting a pullback from the bottom.
Notably, the memecoin has a market cap of $921.42 Million and was ranked 76.
Polkadot (DOT)
The Polkadot token has made a descending triangle pattern and displays a hammer candlestick at its bottom. Afterward, the buyers gained traction, and the token recovered by over 6%.
Still, the buyers want to breach the downward-sloping trendline hurdle of $6.50 and grab momentum.
The price action signified follow-on lower-low swings, and the token underwent a retracement for the past weeks. However, the reversal is on the brink and could blast gains soon.
DOT Price Chart | Source: Santiment
At press time, Polkadot was trading at $6.26 with an intraday surge of 6.06% and a weekly surge of over 3.02%, reflecting a rebound on the chart.
Notably, the token has a market cap of $9.04 billion and was ranked at 16. The key indicators pointed to a reversal and hinted that a breakout rally could be anticipated ahead.
Solana (SOL)
Solana coin has made a triple bottom formation around the $120 mark and has decisively held the gains beyond the 200-day EMA key support.
However, the retracement was still intact on the chart, but the buyers are attempting to breach the prompt 100-day EMA mark and shifting their vision to approach the $150 mark.
Once Solana retains the $150 mark, slowly & steadily, it could go beyond the bars, and an upmove can be seen ahead.
SOL Price Chart | Source: Santiment
At press time, Solana was trading at $140.20 with an intraday surge of 0.96% and a weekly surge of over 1.00%, reflecting a rebound on the chart.
It has a market cap of $65.08 Billion and was ranked at 5. Analysts have guided a bullish guidance on it.
Akash Network (AKT)
Akash Network (AKT) token has made a double bottom formation around its key support of $2.50 and sharply flipped from there. However, the token still attempted to cross the 200-day EMA barrier and hovered in the downside region.
Per the price action, the AKT token has a strong base of around $2.50 until the buyers secure the zone; the downside is capped, while the upside of $4.10 is the prompt hurdle for the bulls to cross.
AKT Price Chart | Source: Santiment
At press time, Akash Network was trading at $3.64 with an intraday surge of 4.96% and a weekly surge of over 2.91%, reflecting a sharp rebound on the chart.
It has a market cap of $148.108 Million and was ranked at 255. The Relative Strength Index (RSI) curve implied a bullish crossover and soared to the overbought zone, implying a positive outlook.
Shiba Inu (SHIB)
Shiba Inu (SHIB) traded inside a falling channel and lost gains for the past few weeks. In yesterday’s session, it took support on its lower trendline and flipped from there.
Still, it was below the key moving averages and hovered in a downtrend. Until the primary hurdle of $0.00002000 was not breached, the trend remained negative, and sell-on-rise activity could be seen ahead.
SHIB Price Chart | Source: Santiment
At press time, Shiba Inu (SHIB) was trading at $0.0000163 with an intraday surge of 4.26% and a weekly surge of over 2.01%, reflecting a rebound on the chart.
It has a market cap of $9.62 Million and was ranked at 14, while it has a total supply of 999.98 trillion.
zKSync (ZK)
Emerged as a cryptocurrency on June 17, the ZK token witnessed retracement in the past few sessions and retested its origin at around $0.131. Afterward, it revealed a recovery and showed a bounce.
However, the price action reflected indecisiveness between the bulls and bears, as the token failed to breach the 50-day EMA mark and faced rejection.
ZK Price Chart | Source: TradingView
At press time, zKSync was trading at $0.1567 with an intraday surge of 0.26% and a weekly surge of over 0.78%, reflecting neutrality on the chart.
It has a market cap of $575.93 Million and was ranked at 107, while it has a total supply of 21 billion.
All in All
These top ten crypto assets are on the list of top gainers and poised for an upmove. Investors have to watch out for these crypto assets and closely track them.
Disclaimer
This article is for informational purposes only and provides no financial, investment, or other advice. The author or any people mentioned in this article are not responsible for any financial loss that may occur from investing in or trading. Please do your research before making any financial decisions.




