

- Ocean performed a positive momentum on Friday’s trading session
- Ocean price is $0.7594, which is up by 30.66% in last 24-hour time-frame and 39.62% up from the previous week
- OCEAN/BTC pair is positive with a gain of 7.94% in Friday’s trading session (0.00001986)
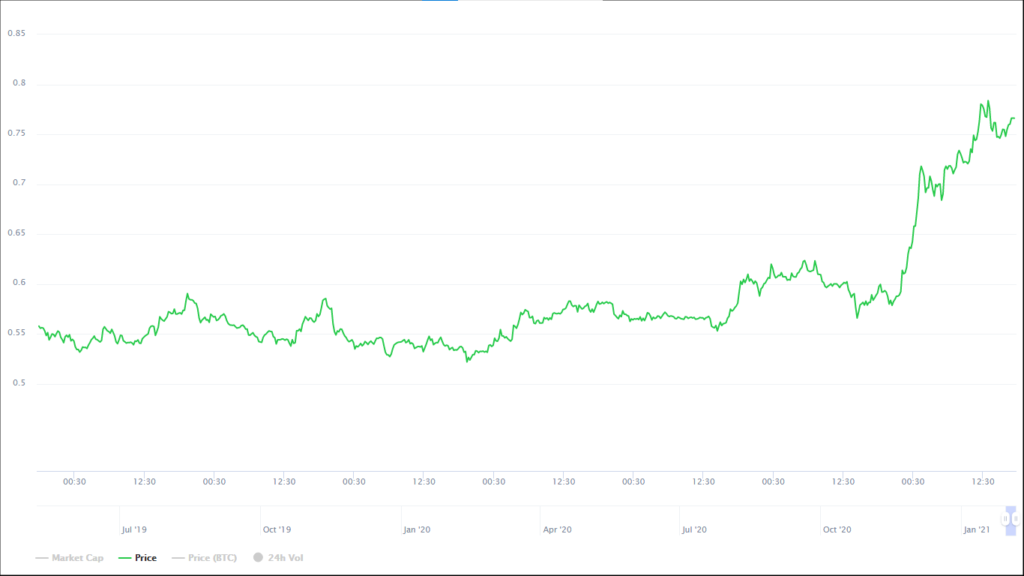
The Ocean had positive momentum on the weekly chart, and it went up to $0.7876 on February 05, 2021, while breaking above the resistance zones created in the past. Ocean price set a mark of an all-time high 6 hours ago. Meanwhile, the trading volume of $75,960,982 in the last 24-hour time-frame represents an increase in the value of 37.43%. The OCEAN/ETH pair is in an uptrend with a value of (0.00044942) which is up by 4.82% in Friday’s market session.
Ocean Technical Chart Indicates A Positive Momentum
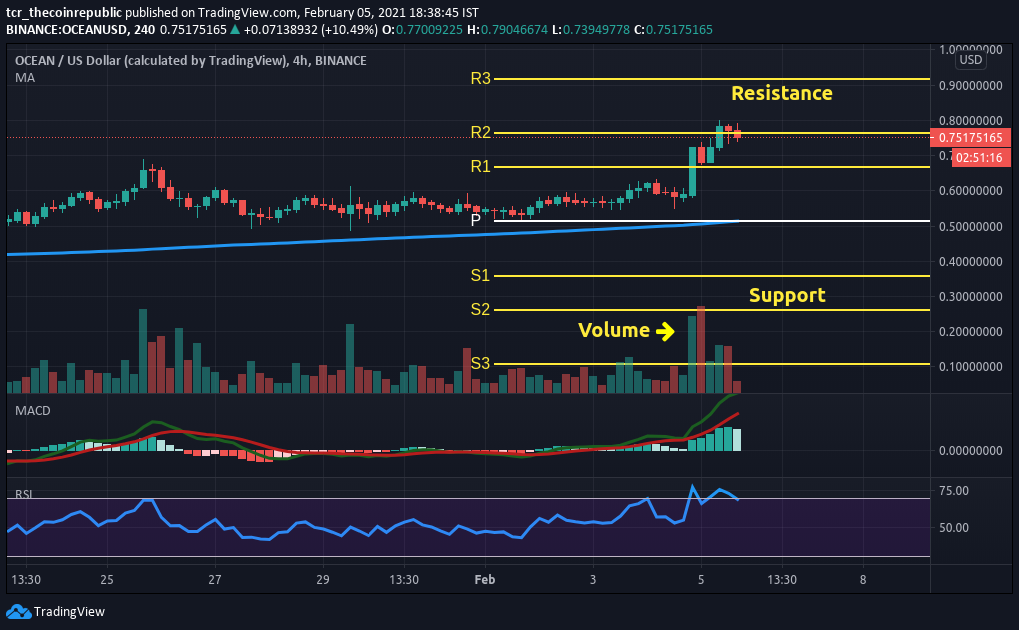
The technical chart of Ocean highlights a positive trend. In contrast, Ocean price is at $0.7876. According to pivot points, the critical support level for COMP is placed at $0.3595. Whereas if it moves up, the key resistance level to watch is $0.9158. While Diving into the weekly chart of a 30-minute time frame, it completes a belt hold bullish candlestick pattern, indicating the bulls have overwhelmed the bears and are now in control.


Volume indicator with the value (2.575M) reflects a selling volume in coin. Investors can further expect an decrease in selling volume in the upcoming trading sessions.
SMA-200, price is at $0.5141, which acts as another strong support in the coin. The price is above the SMA, and investors can expect a bullish trend in the coin for the upcoming trading session.
MACD (Bullish): bullish crossover signal line was spotted on February 05, 2021, during the trading session it indicated a buy signal in the coin. Also, it denotes massive green bars on Histogram.
Meanwhile, the RSI (Bullish): with a value of 68.24 indicates a buy signal in the coin. It may move towards the neutral territory if further selling increases in upcoming trading sessions.
Conclusion
Ocean price is up by 30.66% on Friday’s market session. The price is above the SMA of $0.5141 and may hit the resistance level of $0.9158. All technical indicators suggest a buy signal in the coin for the upcoming trading session.
Resistance: $0.9158
Support: $0.3595


