

- BTG token chart shows a bullish crossover of the 20 and 100-day EMA
- The BTG/BTC pair was trading at 0.001206 BTC with a gain of 0.34%
- The 24hr trading volume in BTG token is $244.9 Million
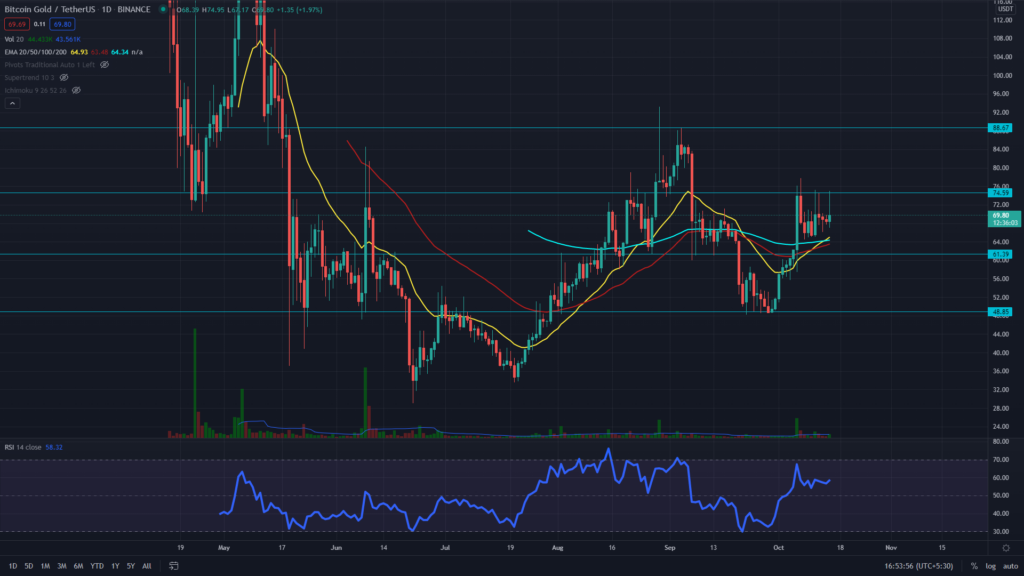
The BTG token suggested the end its moderate retracment phase when the price bounced from the $48.85, with a double bottom pattern. After that the price has shown a remarkable rally, which has brought it to another strong resistance of $74.5. The token price has been trying to breakout from this level for more than a week now, but has not yet succeeded.
Concerning the EMA’s, the BTG token is trading above the 20, 50, and 100 EMA, indicating a bullish trend in this token. In addition, the chart also shows a golden crossover of the 20 and 100 EMA, attracting even more buyers in the market.


The RSI value is at 58, indicating a bullish sentiment in the price. Moreover, the RSI line has shows an impressive rally in its chart, projecting the increasing strength of token buyers.
BTG Token Shows A Possiblty Of A Double Bottom Pattern
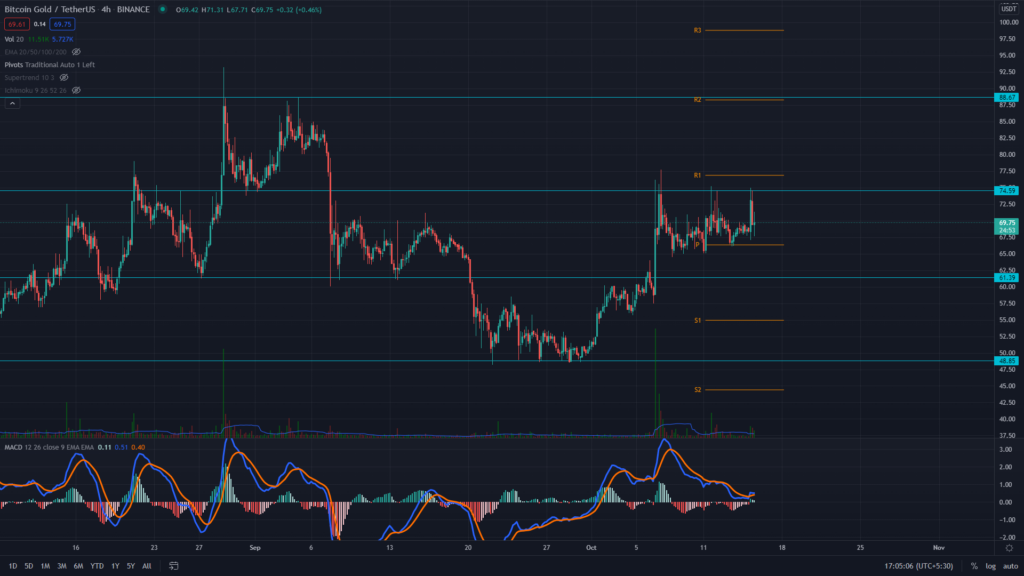
The BTG token price forming a double pattern in the 4hr time frame chart. The neckline for this pattern is . 2 and 2 Hz stimulation was observed. 5, holding an excellent long opportunity for BTG traders, once the price gives a proper breakout from resistance level.
The MACD indicator (BULLISH) shows both the MACD and the signal line are still holding above the neutral zone(0.00), indicating bullish momentum is still intact. However, getting this close to the middle line, indicate some weakness in the price.
Conclusion: From the technical perspective, the short term trend for BTG in bearish, however, the recent price active has provided positive outlook for the token. And as mentioned, the price is again trying to breachfrom the near resistance of $74.5. Anyhow, the crypto traders should only entry if the price provides a proper breakout from this level.
Support– $61.4
Resistance– $74.5


