

- INTC stock has gained a massive spike in the past few sessions.
- Bulls are looking extremely strong and persist to gain.
Intel Corporation stock ( NASDAQ: INTC ) price has conducted a massive buying action in the last few sessions riding an uptrend. INTC stock rose by more than 18% in the prior seven trading sessions. Bulls were overwhelming the battle, and sellers were looking tangled.
The price action shows a shunned move on the charts displaying a long marubozu candle with a huge volume spike, which shows buyers accumulated the stock. Moreover, a short covering move was noted on the charts. The stock fled above the immediate resistance mark of $30 and commenced moving beyond the significant moving averages.


Furthermore, this up move makes a trendline breakout of $30. Bulls are gaining traction, and the stock is steering toward the resistance mark of $33, and $38 follows on.
Intel Corporation is engaged in designing and manufacturing products and technologies. The Company’s segments are Data Center Group (DCG), Internet of Things Group (IOTG), Mobileye, Non-Volatile Memory Solutions Group (NSG) and Programmable Solutions Group (PSG).
At press time, Intel Corporation traded at $31.31 with a surge of 0.58% showing a bullish trend. Moreover, the trading volume shown in the last session was at 36.521 Million. INTC stock has a market cap of $130.594 Billion.
Daily Charts Shows Range Breakout
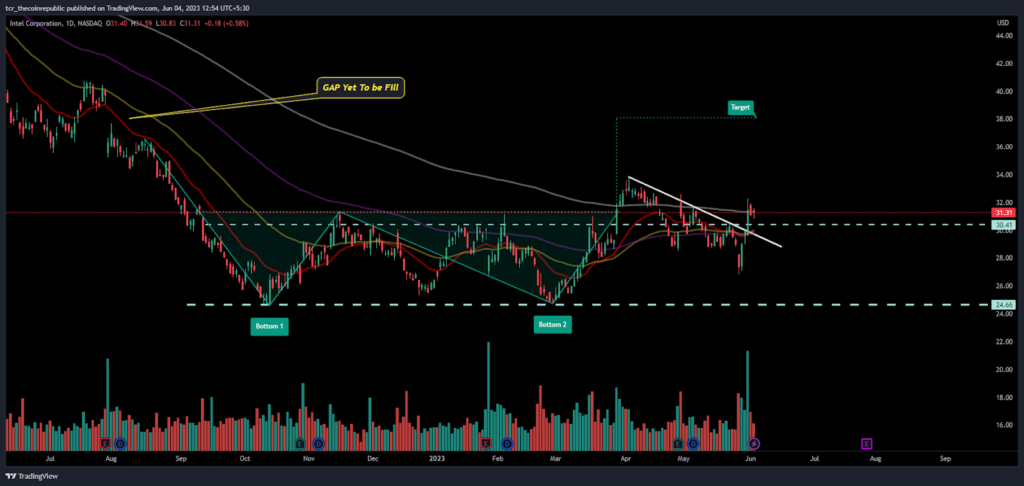
On the daily charts, INTC stock directed a range breakout toward the next resistance mark of $33. Based on the chart formation, there is a pending gap yet to be filled near $38, and buyers will soon assert the mark.
INTC stock is trying to go above the upper Bollinger band and for a breakout but facing a lack of momentum.
The constant trend implies that INTC stock has a range breakout above $30, and buyers are attaining traction this week. The rise in the acceleration of bulls’ momentum showed that the stock is climbing the gains and will retest the swing of $38 soon. Moreover, the chart shows a double bottom pattern which has a neckline of $33. If it spoils, the stock will obtain $38, following the 52-week high of $44 in the upcoming months.
Short Term Charts Shows Bullishness
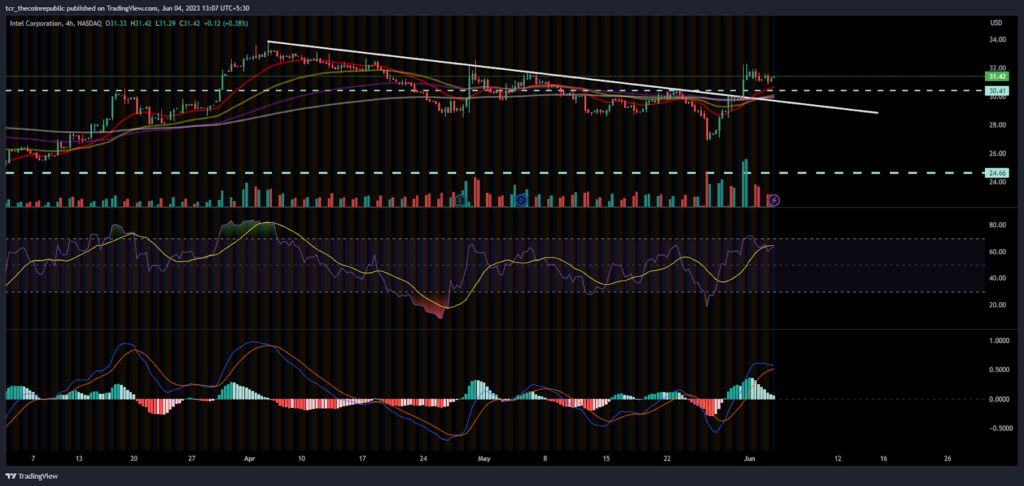
On the 4-hour charts, Intel Corporation stock shows a solid bullish action, ushering a positive stance. The technical parameters are also suggesting a bullish view of the stock.
The RSI ascends in the overbought zone and sails the bullish cues constantly. Moreover, it shows a positive crossover which still conveys the gains.
The MACD indicator shows a bullish crossover, and the chart leads up in uncharted territory where buyers have shown resilience.
The green bars on the histogram show that the stock is trading in the bullish territory and buying persisted.
Conclusion:
Intel Corporation stock ( INTC ) price is heading towards the resistance mark of $33 in the upcoming sessions and showed a positive outlook.
Technical Levels-
Resistance level- $33 and $38
Support level- $30 and $28
Disclaimer-
The views and opinions stated by the author, or any people named in this article, are for informational purposes only and do not establish financial, investment, or other advice. Investing in or trading crypto assets comes with a risk of financial loss.


