
 Pearl
Pearl Pudgy Penguins
 NEAR Protocol
 Quack AI
 Canton
 Starknet
 Derive
- The Syscoin crypto price fell 10.54% during the weekly trading session.
- The current price seems to be forming a descending triangle pattern.
- An uprise of 40.29% has been observed in the volume of the SYS token in the last 24 hours.
Created in 2014, Syscoin (SYS) is an open-source project that combines the strongest elements of Bitcoin and Ethereum on a single platform. SYS allows merge mining with Bitcoin using a consensus algorithm based on Bitcoin’s SHA-256 PoW model.
The SYS Crypto has provided quality returns in February and March 2024. The price collectively delivered over 130% positive returns during those months. However, April and May 2024 seem to be facing some initial profit bookings.
Will the SYS Price Correction Phase End Soon?
At the start of March 2024, the Syscoin price experienced a strong approach from buyers. They rallied the crypto price over 110% in just ten days from the $0.1828 price level. Subsequently, the price reached the $0.3865 resistance level and faced some initial profit bookings, resulting in the current correction phase.
In the last seven days, the SYS crypto has declined 10%, underperforming the global cryptocurrency market. Compared to similar cryptocurrencies like Oasis and Kadena, Syscoin outperforms during the intraday trading session. The current market cap of SYS stands at $143 Million, with a circulation supply of 783 million tokens.
Price Volatility & Social Dominance Analysis
In mid-Feb 2024, a noticeable rise in social buzz of Syscoin crypto can be seen in the above chart. The social dominance rose above 0.121%, which had a positive impact on price. The price volatility, on the other side, reflects higher volatility when the price falls.
The upsurge in sentiments has a positive effect on the SYS price. However, the dominance seems to be fading away in recent sessions, currently covering 0.005%.
Technical Analysis of the Syscoin (SYS/USD)
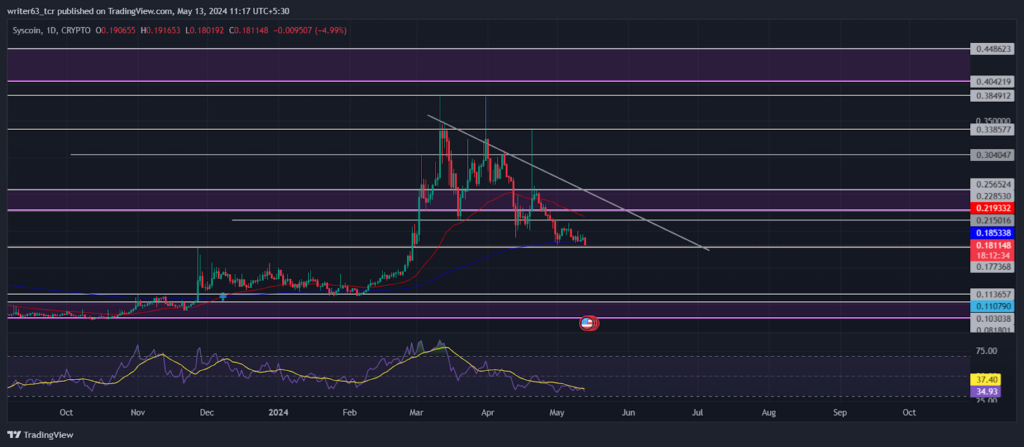
The current price slipped below the key exponential moving averages, indicating a short-term bearish outlook. A shift in bearish sentiments can be expected if the price makes a strong bearish move in the current phase below the 200-day EMA.
The SYS crypto price faced a strong bearish rejection from the $0.3385 supply level. It has been following a trendline since March 11, 2024. It is underperforming in a descending triangle pattern. The current price moved toward the $0.1773 decisional bullish point of interest (POI), which holds a possibility of a potential reversal.
The relative strength index (RSI) shows weakening bearish momentum in the current phase. The RSI line oscillates at the 36.21 mark, indicating neutrality over the current price.
Summary
The Syscoin crypto price has been performing with bearish sentiments since March 11, 2024. Earlier, a strong bullish upsurge in SYS price was seen from the $0.1828 price level. The current crypto price experienced a correction phase while moving under a descending triangle. The price moved toward the $0.1773 decisional bullish POI, which can lead to a shift in bullish sentiments.
Technical Levels
At the time of writing, the key resistance level for the SYS price was at $0.3385, and the $0.1570 level was the next support. If the price makes past the upper resistance level, a rise might be possible. Conversely, a drop below the mentioned support level can lead to a price pullback to the lower levels.
Disclaimer
The views and opinions stated by the author or any people named in this article are for informational purposes only. They do not establish financial, investment, or any other advice. Investing in or trading crypto or stock comes with a risk of financial loss.




