

- COST stock recovered the strength and looking for an breakout.
- Bulls regain the momentum and attain momentum.
Costco Wholesale Corporation ( NASDAQ: COST) stock has attained strength again and recovered the gains from the lower mark of $475 this week amid the weak numbers noted in the Q1 earnings report. The price action showed neutral perspectives until the last week because the price faced multiple resistances, but now the stock is trading above the 20-day EMA and showing fresh bullishness, ready to glow further.
Moreover, the COST stock is escaping above the 20-day EMA and breaking the trendline of $500, the most crucial hurdle. However, mighty bears were trapped and noted a short covering move in the last session.


Costco Wholesale Corporation operates membership warehouses in the United States and Puerto Rico, Canada, the United Kingdom, Mexico, Japan, Korea, Australia, Spain, France, Iceland, China, and through its subsidiaries in Taiwan.
Recently, COST stock came into the news when the company said, ” When you sign up for membership, then you will get a gift card up to $30, and this offer is valid till 11 June. This news reacted positively, and the stock surged by 1.73% in the last trading session. Moreover, analysts estimate a growth in the stock and expect a rise in the stock.
At press time, COST stock was traded at $520.09 with an intraday surge of 1.73%, showing a positive outlook. Moreover, the trading volume was noted at 1.531 Million.
Will COST Stock retest $550 this month?
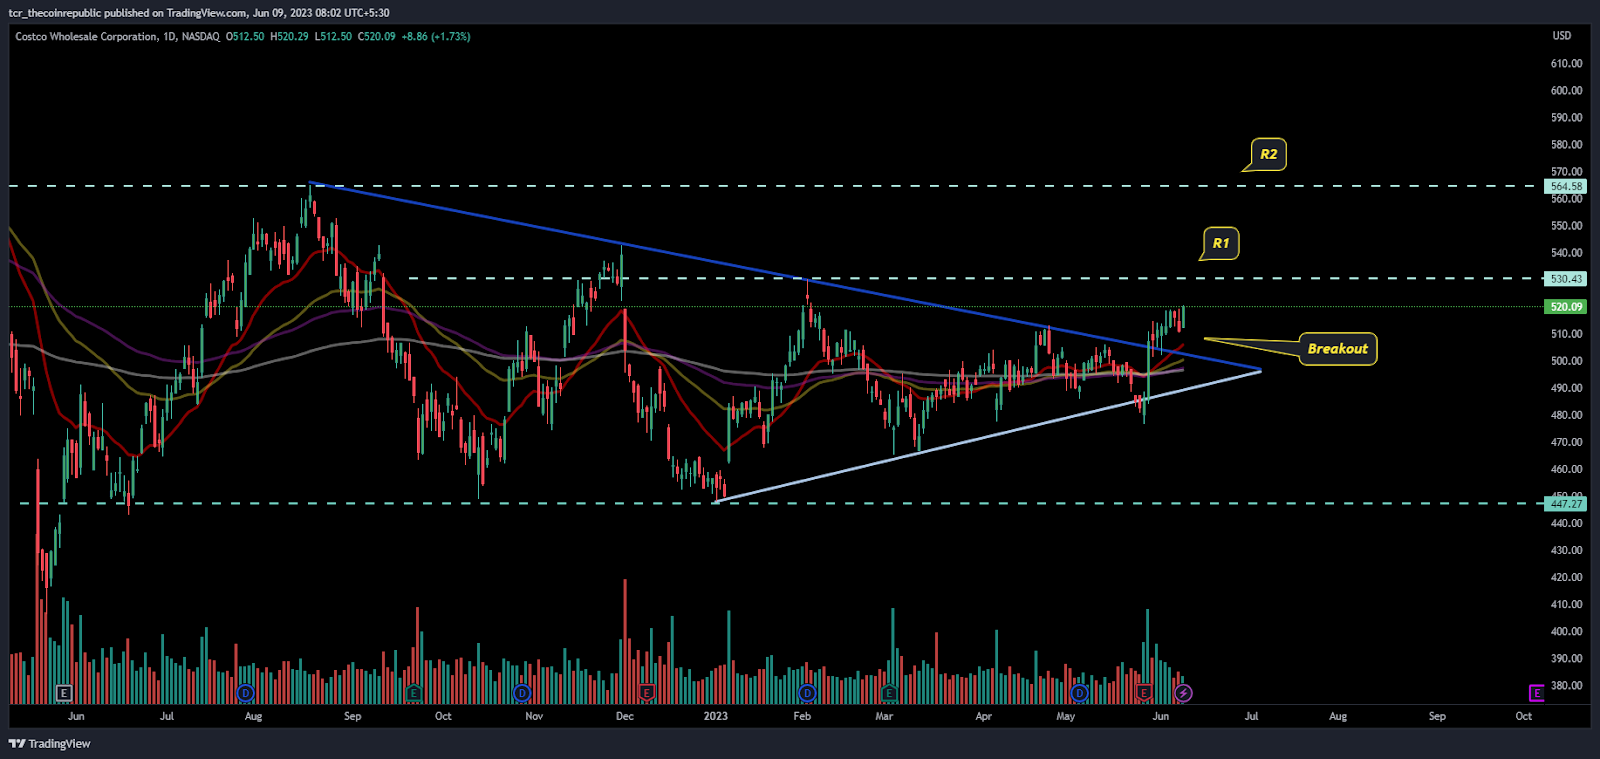
On the daily charts, COST stock is showing a breakout above the critical mark of $500 and breaking the trendline of the symmetrical triangle pattern. Moreover, the bullish marubozu candle formed in the last session shows the firm grip of the buyers, who maintained their solid presence and gained traction from the lows of $475.
Last week, when stock floated the numbers in the market, COST stock showed a gap-down move and retested the support mark of $475, which is the strong demand zone buyers showed their muscles over there and pumped up the stock, and afterward, the stock does not look back.
What Technical Indicators Say About COST Stock?
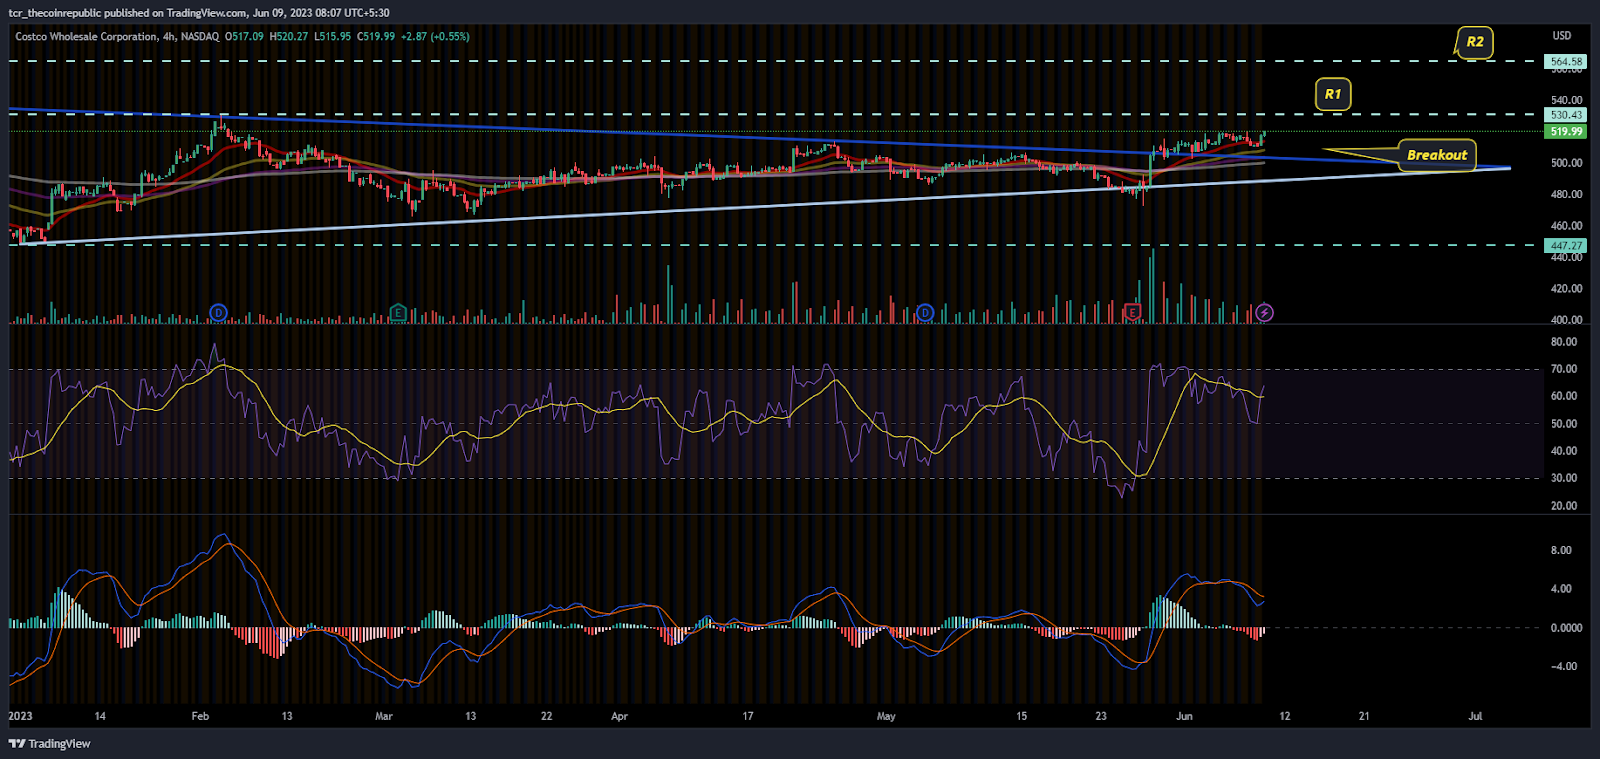
On the 4-hour charts, COST stock was near its R1( shown on the chart) at $530, which is the immediate hurdle to retest soon. If stock surpasses, it will rise to R2 near $550.
The RSI of COST stock is near 60 and shows an inclined curve after retesting the neutrality. Moreover, it offers a positive crossover indicating that buying action increased from the last session.
The MACD indicator does not project the buying conviction, but the MA line is near a crossover and will project bullishness soon.
Conclusion:
COST stock has shown a reversal from $475 and persists in gaining from the support levels. Analysts expect a surge in the upcoming sessions.
Technical levels:
Major support: $500
Major resistance: $530
Disclaimer:
The views and opinions stated by the author, or any people named in this article, are for informational purposes only and do not establish financial, investment, or other advice. Investing in or trading crypto assets comes with a risk of financial loss.


