

- The price of IOTA (MIOTA) is trading at $0.185 with an increase of 0.53% in 24 hours.
- IOTA’s ( MIOTA) market cap is $502.785 Million.
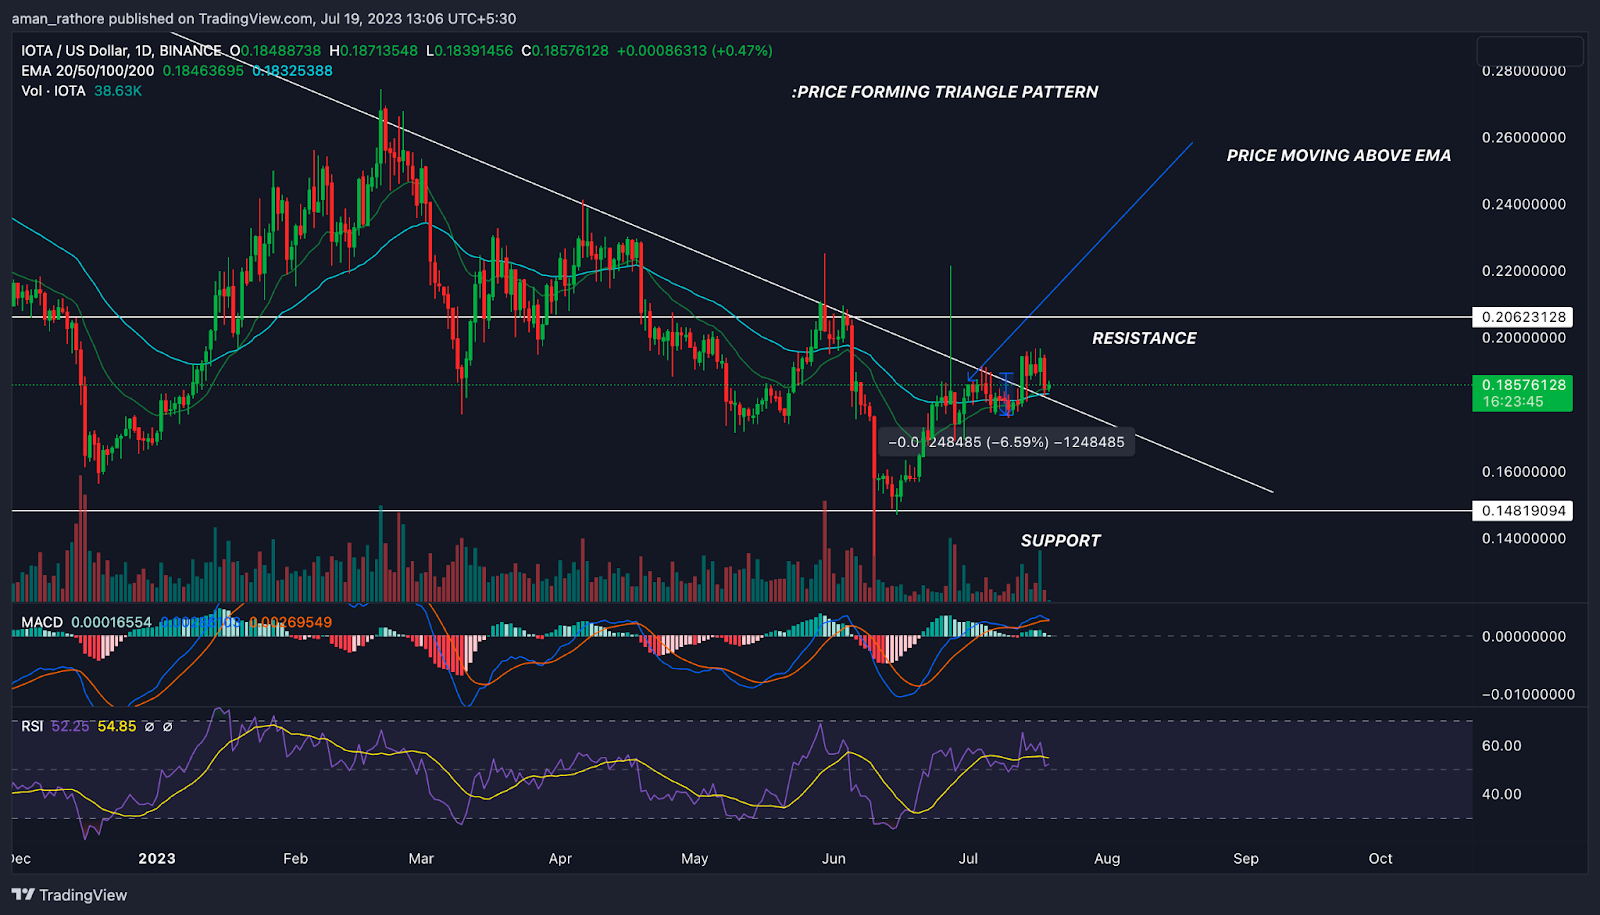
- The price of IOTA (MIOTA) is trading above 20-day and 50-day EMA levels.
IOTA (MIOTA) is a distributed ledger technology (DLT) protocol and blockchain-based cryptocurrency for the Internet of Things (IoT). A distributed agreement system (DAG) that is decentralized and scalable, MIOTA is built on the Tangle (Royalty-Free) technology. IOTA (MIOTA) is a perfect M2M protocol because its major goal is to make data exchange and microtransactions between IoT devices easier.
The daily chart analysis reveals that MIOTA is now in an uptrend and making higher lows. Since April 2021, IOTA’s price has been falling and has dropped by around 92%. The price has moved away from $0.14919094, an important support level, which is also significant to notice.


A triangular pattern has developed on the chart and the price has delivered a breakout from the resistance level with excellent volume. The IOTA price is currently exhibiting a slight correction but the daily period structure of the IOTA ( MIOTA) is anticipated to grow in a constructive manner.
The price is likely to move smoothly till the next resistance level of $0.206. he price of MIOTA can take a halt before launching.
Technical Analysis (1D Timeframe)
IOTA Price Analysis
EMA
The price of the cryptocurrency IOTA is currently above the exponential moving average (EMA), and as long as the EMA moves in the right direction, it is signaling a positive trend.
RSI
The price is quite likely to rise above the level and take control of it because the Relative Strength Index (RSI) for MIOTA is above the SMA line and the signal line is around 55.
MACD
In the current market scenario, the daily MACD line is crossing the signal line, favoring the bullish advance, signaling a shift in the trend in the bulls’ favor. Traders may soon view this as a positive development for the price of MIOTA.
Trendline Analysis:
The analysis shows that the price of IOTA (MIOTA) is now moving upwards. The possibility for price growth is further supported by the most recent breakout and the creation of a favorable pattern.
According to indicators like Moving Average Convergence Divergence (MACD), Relative Strength Index (RSI), and Exponential Moving Averages (EMA), a price rise is likely for IOTA.
Conclusion
As per the analysis of IOTA in the daily timeframe, several indications are emerging that lead to an increase in its price. A rise in IOTA (MIOTA) price can be expected if the level described above can be broken with sufficient volume. The overall trend of the MIOTA coin is bullish when looking at the long-term chart. The bullish indicators include MACD, RSI, and EMA.
Technical Levels
- Support – The current support level of the IOTA coin is $0.1481.
- Resistance -The current resistance level of the IOTA coin is 0.1972.
Disclaimer
The information provided in this article is solely for information purposes and is not intended to provide financial, investment, or any other advice. Trading or investing in crypto involves the risk of loss.


