

- ELF is trading at $0.345 with a decrease of 0.5% in the last 24 hours.
- It is presently trying to regain its movement above the 50-day EMA.
- The aelf token has recorded positive gains of 178% in a year.
The ELF coin price started to move on a bullish trendline from the 3rd week of August, where the price was moving above the 50-day EMA. Coin’s price made new higher highs to $0.400. It got bearish from there and broke below the trendline and the 50-day EMA.
The price took support from the level of $0.333 and tried to cross the EMA but the bearish investors sitting on the EMA pushed the price down again. Presently, it is again trying to break it and getting rejected.


The token marked an all-time high of $2.77 on 10th November 2021. It is almost 87.55% down from its all-time high, bringing it to a level of $0.345. The market cap of the token during the high was at $610.48 Million.
The daily trading volume of the token has declined by 7.23% in the last 24 hours. The total circulation of the tokens is currently at 672.98 Million, which is 67.30% of the total supply. It has a current market cap of $232.84 Million.
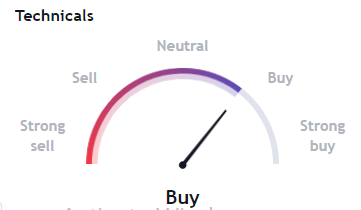
The technicals, which include a summary of oscillators and the moving averages, indicate a buying zone in the price which is a sign of a bullish move.
Sentiment Analysis
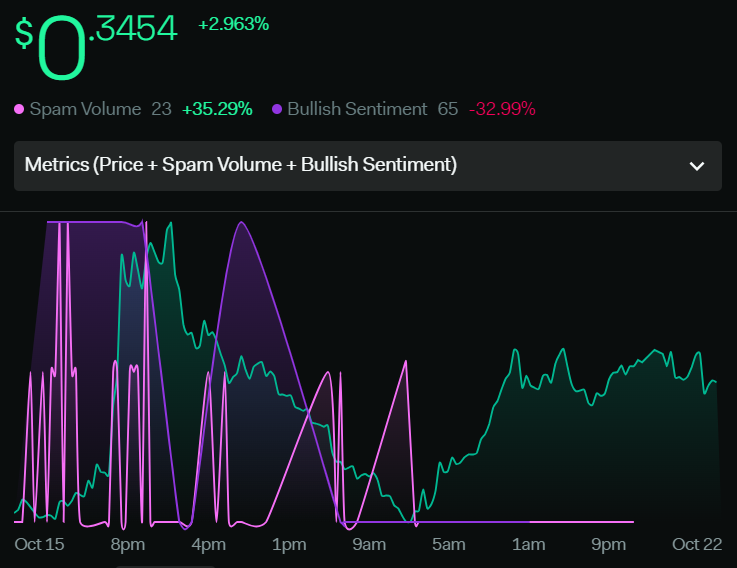
The total volume of the token has increased by 117% within a week due to which the price got a surge of 2.96%. Spam volume of the token has also increased by 35.29% and the total bullish sentiments decreased by 32.99% as the price is currently getting rejected from the 50-day EMA. Overall analysis indicates a bullish move as soon as the price crosses and sustains above the EMA.
Technical Analysis Of the ELF Token (Daily-1D)
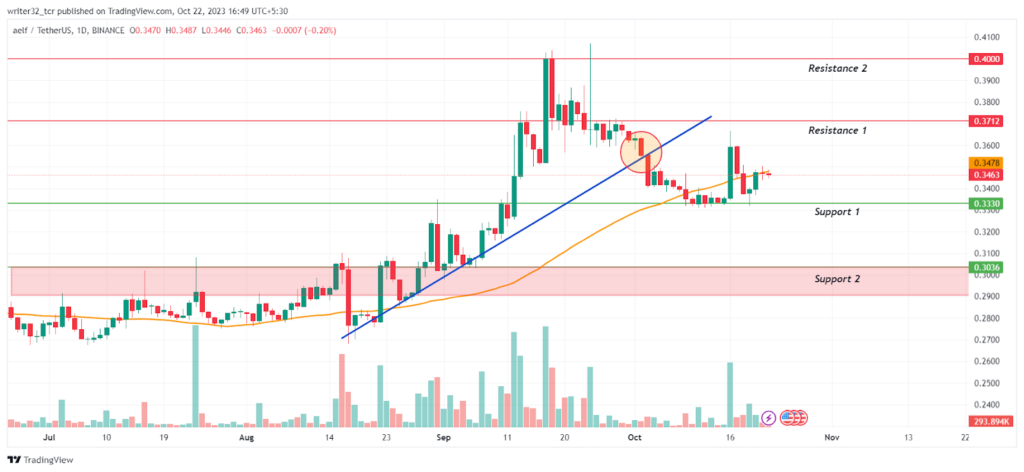
If the ELF coin price crosses the 50-day EMA and sustains above, it can get bullish and reach $0.371 to $0.400. Suppose the coin price gets rejected again from the EMA, it can fall to the support level of $0.333 and try to cross the EMA once more. The buyers will have to be more dominant on the sellers to cross and sustain above the 50-day EMA and give a bullish move to the price.
However, If the buyers lose their dominance and the price breaks below the support level of $0.333, it can fall down to the downside support level of $0.290 to $0.303.
Indicators on the Price of the ELF Token
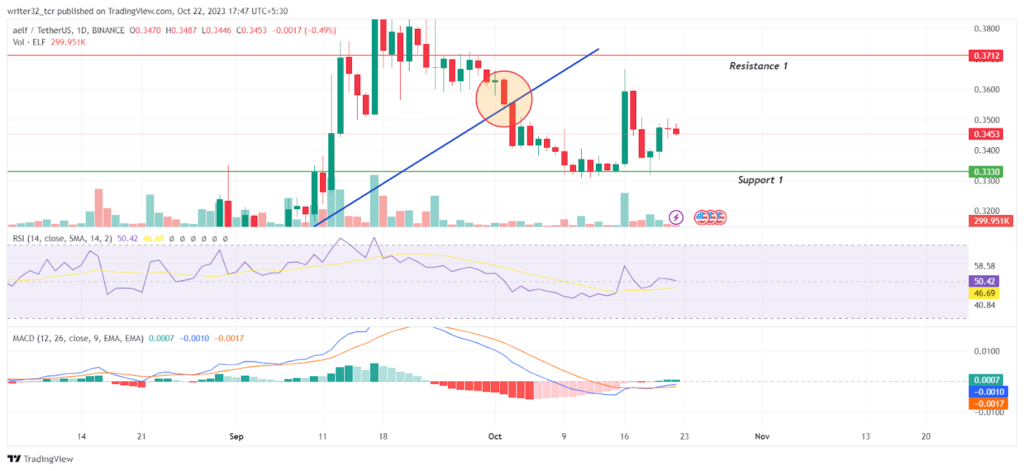
Relative Strength Index (RSI)
The RSI line is moving at 50.42 points and the SMA 14 at 46.69 points. The RSI line is above the neutral level. It is getting a bounce from the SMA14. Whenever RSI bounces from the SMA 14, the price also gives an upward move.
Moving Average Convergence/Divergence (MACD)
The fast blue line moving average gave a bullish cross above the red slow line moving average. The histogram has started to show a green move in volumes which is a positive sign for the price.
ELF LIVE CHART
Conclusion
The overall analysis of the ELF token suggests that it is presently bearish until it crosses above the 50-day EMA. Once it breaks above that level, it can be bullish and give a good rally. Also, If it loses the support level of $0.333, then the price will get bearish again.
Technical Levels
- Support Level: $0.290 to $0.303 and $0.333
- Resistance Level: $0.371 and $0.400
Disclaimer:
The views and opinions stated by the author, or any people named in this article, are for informational purposes only and do not establish financial, investment, or other advice. Investing in or trading crypto assets comes with a risk of financial loss.


