

- The GLM crypto price has dropped by 23% in a week.
- Golem crypto price has slipped below the 20-Day EMA reflecting selling pressure.
According to the technical chart, the Golem crypto price has been in a bullish trend and witnessed a 169% rise since February. The price has recorded an all-time high of $0.776 on March 03, 2024. The bullish trend has disturbed near the $0.700 hurdle and shown selling pressure.
The price faced resistance from the $0.700 mark and declined by 33% in just 2 days. It attempted again but sellers were strong enough to drag down the price. The price has melted by approximately 20% in the last few weeks and it seems that buyers are unable to dominate this level.


At the time of writing, the Golem crypto price was trading at $0.555 with an intraday gain of 0.23%. The market capitalization is $555 Million and the 24-hour trading volume is $46 Million which has dropped by 46.43%. The circulating supply and total supply is 1,000,000,000 GLM and the fully diluted market cap is $557 Million.
Golem Crypto Price vs Volume Analysis
The GLM chart shows a sharp fall in the trading volume in the last 10 days – from $1.03 Billion to $46 Million, but the price has almost remained constant. According to this data, the GLM crypto price may underperform.
Will Golem Crypto Price Extend to the $1 Mark Soon?
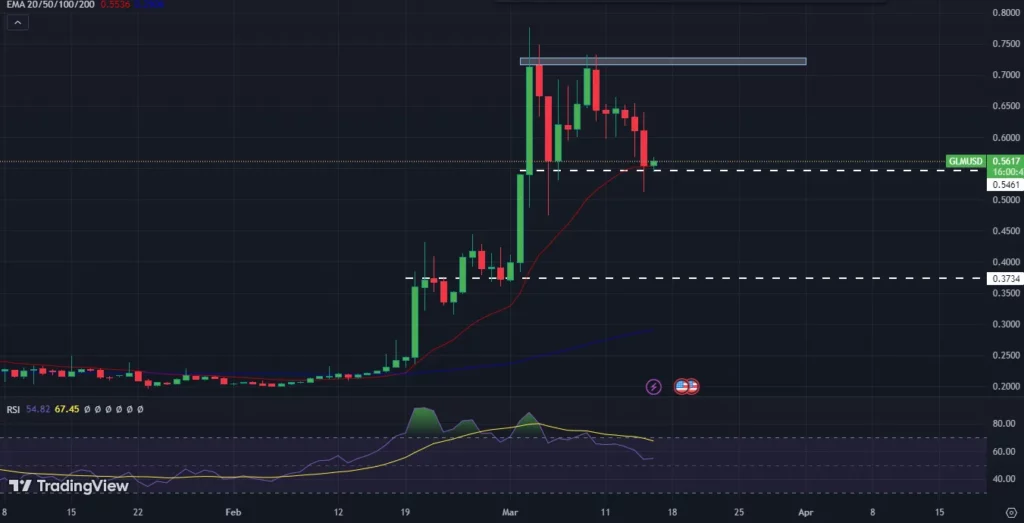
On a daily time frame, the Golem crypto price has been in a bullish trend for a wider time frame, but sellers seem to be active in the short term. It has formed a double-top pattern near the $0.700 hurdle and the selling price has been observed for the last few days.
The GLM price has just slipped below the 20-Day exponential moving average showing the bears’ grip. If the price sustains below the EMA then it may form a complete double-top pattern so the investors may prefer to book profit which may lead to a sharp downfall.
Alternatively, suppose Golem manages to defend the 20-Day exponential moving average and rises, then it may record a new all-time high in a few days. If the buyers remain strong and trading volume increases then it may outperform further.
The RSI is at 54. It is declining steadily and is heading for the oversold zone. The GLM price is trading over the significant moving average which indicates that the overall trend is bullish.
Golem Price Prediction Over 4-H Timeframe
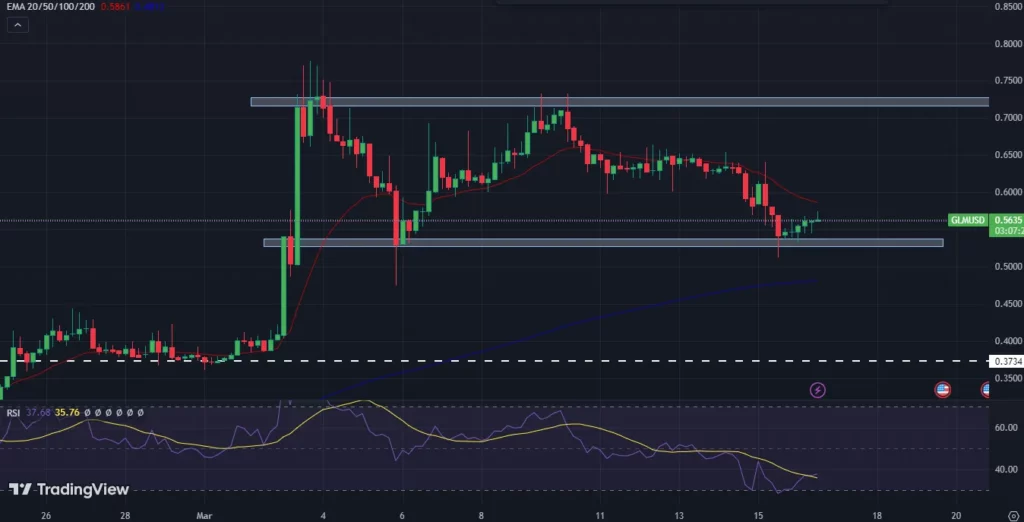
In a 4-H time frame, the GLM crypto price has been struggling in a parallel channel and trying to trigger a pullback to generate a selling signal. Suppose the price slips below the support line of $0.530 and sustains then selling pressure can be expected.
But if it fails to defend the support level of $0.530 and surpasses the 20-Day exponential moving average then the price may approach the last swing high in a few days. Suppose the price manages to sustain the $0.700 mark then a bullish trend for the long term can be expected.
Conclusion
The technical chart displays the strong buying momentum on a wider time frame but in the short term, sellers are dominating and investors are booking profit. It has declined by 27% from the all-time high. According to the analysts, the price will remain bullish over the 20-day exponential moving average and the selling signal will generate below the 20-Day EMA.
Technical Levels
Resistance Levels: $0.650 & $0.700
Support Levels: $0.500 & $0.370
Disclaimer
This article is for informational purposes only and provides no financial, investment, or other advice. The author or any people mentioned in this article are not responsible for any financial loss that may occur from investing in or trading. Please do your research before making any financial decisions.


