

- Paramount Global’s stock pays a dividend of -41.03 every quarter.
- PARA’s stock price has given a return of -35% in the previous year.
- Paramount Global’s basic EPS is $1.88.
Paramount Global is a global media and entertainment company with operations. The company conducts its business through three main segments: TV Media, Direct-to-Consumer, and Filmed Entertainment.
Trend Analysis
The current direction of the stock price of Paramount Global, Inc. (NASDAQ: PARA) is heading downwards. It is worth noting that PARA’s stock price has been trading within a specific range while consistently creating new lower lows.


If we look back to March 2021, Paramount Global (PARA) stock experienced a peak when it reached a value of $101.97. However, following this peak, the stock price began to decline steadily. By the end of November 2022, the stock had depreciated by nearly 85%. This decline in value led to the stock reaching an all-time low, and it currently continues to trade near these historically low levels.
Currently, the price of the PARA is moving inside a falling wedge pattern. This is a weak signal for the stock. The overall price is forming a weak structure, and the price is likely to decline in the future.
Taking a closer look at the weekly timeframe of Paramount Global Inc.’s stock, we can observe a rather frail structure. The current price movement suggests that we anticipate the attainment of fresh lows in the near future.
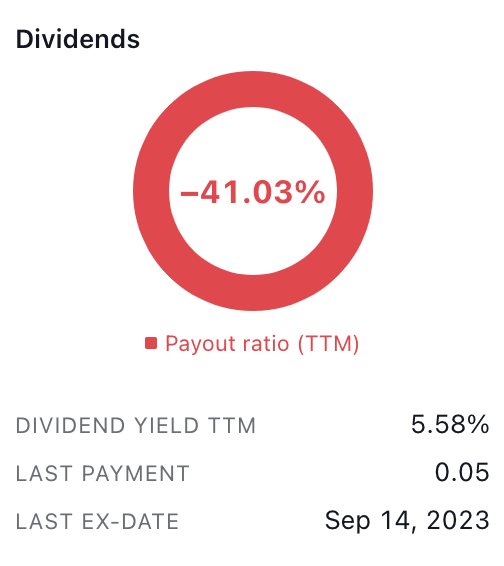
The dividend payout ratio of the stock is -41.03% and the dividend yield is 5.58%. This shows that the company is burning its profits to pay the dividends. This can further denote that the company’s financials are weak.
Paramount Global Inc. (PARA) Stock Price Analysis
aa by writer50_tcr on TradingView.com
The Paramount Global Inc. price is currently situated below two significant levels: the 50-day and 100-day EMA levels. This particular positioning strongly hints at the stock is in a downward trend, signalling the possibility of further price decreases on the horizon.
Moreover, when we examine the technical indicators, it can be seen that the signal line and the MACD line for PARA stock are positioned below the zero line. Additionally, the emergence of a red histogram indicates a downward pressure affecting the stock’s value.
Furthermore, if looking at the RSI line and the 14-day SMA line for Paramount Global Inc. shares (PARA), we notice that both are hovering close to the 30 mark. This positioning indicates that both indicators are dwelling in the negative territory, which in turn implies that there may be room for the price to decrease in the foreseeable future.
Conclusion
As per the analysis findings, it appears that Paramount Global Inc.’s (PARA) stock price is presently following a downward trajectory and could potentially decrease its value down the road. Notably, the formation of fresh lows in the price, and various indicators are providing unfavourable signals. All these factors seem to point toward the likelihood of prices experiencing a decline in the upcoming days.
Technical Levels
- Support Level: $14.
- Resistance Level: $17.40.
Disclaimer
The views and opinions of the author, or anyone named in this article, are for informational purposes only. They do not offer financial, investment, or other advice. Investing or trading crypto assets involves the risk of financial loss.


