Covenant x402
 Tetsuo Super Intelligence
 Doge Pepe
 Boomer
 hi
 Pudgy Penguins
 Claudia

- BTT uniqueness is that it started as to disrupt the entertainment legacy and consumers content obtainment.
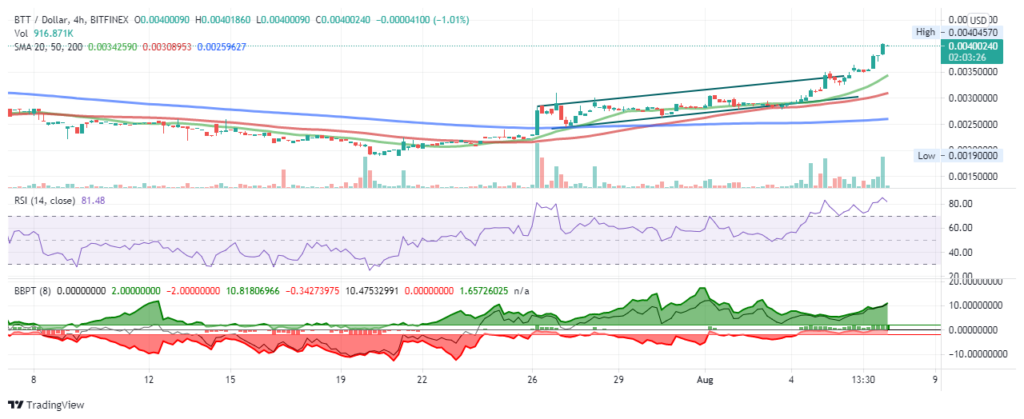
- The token has shown the pattern of three inside up on 6 August, 2021.
- The RSI oscillator for BTT shows the BUY action.
The circulating supply of 659,952,625,000 BTT coins and the max. supply is not available. The last known price of the token, BTT, is 0.004015 and is up by 13.14% over the last 24 hours. It has the current trading volume(s) of 644,438,856 with a gain of 6.85% over the last 24 hours.
BTT has addresses of 50,233 with the active transfer(s) of 310,228 in the last 24 hours. The intraday high of the token is 0.0040 that formed after the low went to 0.0037. The token is up by 12,84% to 0.00400 now.
The chart above shows the movement of BTT where 200 DMA has been running below it and even DMA-50 is below it. We see the token with respect to SMA’s which are 20, 50 and 200 and it is SMA-20 which is above than the other two. We see an upward pattern. The trend line marked shows this upwards shifting. The candles forming now have completely crossed the trendline and are far away from it.
Its top 10 and 20 holders have more than 50% holdings and top 50 and 100 have more than 60% which makes the decent supply side of the coin.
An RSI oscillator is also present in the chart which shows the proper time to buy or sell the token. RSI for the last 5 hours shows the value of 72.23 and marks the buy action. MA-5, MA-10 and MA-20 show the buy action. MA-100 and MA-200 show the same buy action. However, the BTT at present is all set to sell(own perception).
The bull/bear power has the value of 0.0000 and shows the neutral action. The high/low marks the buy action with the value of 0.0001.
The BTT-BTC pair is trailing at the level of 0.00000009207 and the gain of 4.95% was seen whereas the BTT-ETH pair is trailing at the level of 0.000001348 and the gain of 5.89% was seen in the last 24 hours. The volume/market cap of the token is 0.2431 and its market dominance is 0.15%.
Conclusion: The days range for the coin is 0.003458-0.004085 and presently is at 0.00400. The 24 hours high and low of the coin is 0.00408-0.00347 respectively.
One year percentage change in coin is 849.79%
The token has entered the positive returns zone which is also a selling zone. Based on your expectations, choose the right action. The ATH and ATL of the coin is 0.01426 and 0.0001394 respectively. ROI of coin is 3241.91%
Technical Instruments:
Pivot: 0.004017
R-1: 0.004055
R-2: 0.004078
S-1: 0.003979
S-2: 0.003956
Note:
- The unit is USD
- SMA-20: Green colour
- SMA-50: Red colour
- SMA-200: Blue colour