Doge Pepe
 Claudia
 hi
 Covenant x402
 Quantus
 Pudgy Penguins
 Pearl

- EOS has current/Max TPS of 22/3996.
- Doge top 10, 20 and 50, 100 holders have more than 70% holdings.
- RSI for EOS (for today) shows the BUY action.
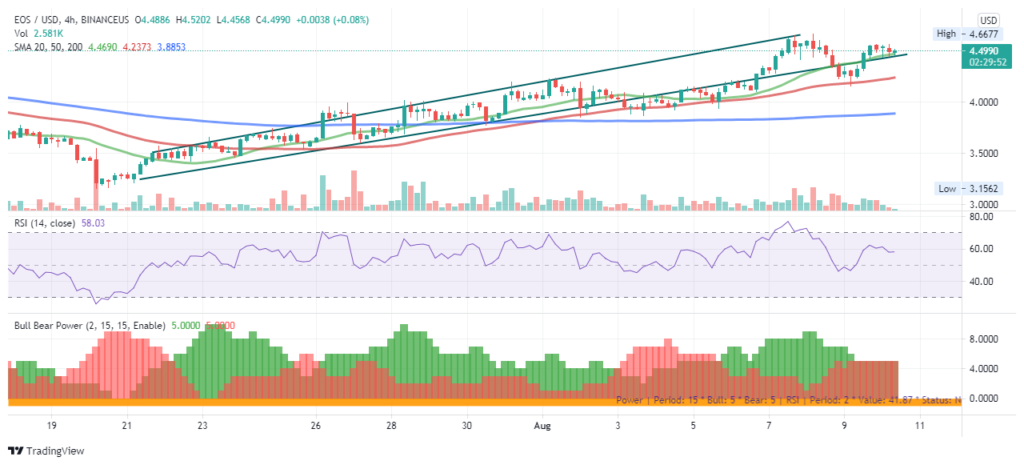
EOS coin has been entertained by the external market since 24 July.
However, crossing the past barriers, EOS has crossed the path of the barrier and has shown the explosive upswing. Compared to other coins, EOS demand is immensely high.
The token has formed the pattern of bullish engulfing recently.
The token’s price trailed at the $3.00 zone multiple times and the zone acted as a strong resistance to it. From 1 to 5 August the coin faced difficulty to climb the leader. Acquiring support at 4.00, the coin crossed its resistance level and marked the high at 4.6677 on 8 August.
At the time when other altcoins were seeing major rallies, this meme coin has been showing gradual increase in the price level
Considering the recent hike, a retracement to 4.55 to 4.250 would be visible.
EOS rose by 3.20% on Monday. Following a 5.59% gain from Sunday, EOS ended the day at 4.54. The last known price of this coin is 4.4985. A mixed start for the day saw EOS rise to an early morning intraday high of $4.5638 before hitting reverse.
EOS seems to have trailed close to its then first support level, and had acquired support at $4.2504.
At the time of writing, EOS was up by 5.81% to 4.4988.
It has the current trading volume(s) of 1,093,905,471 with a low of 0.74% over the last 24 hours. EOS has addresses of 13,754 holders with the active transfer(s) of 410,138 in the last 24 hours.
The circulating supply of token is 955,923,443 EOS coins and the max. supply is not available. The total supply (The amount of coins that have been already created, minus any coins that have been burned. It is analogous to the outstanding shares in the stock market.) is 1,032,007,188.
SMA-20, SMA-50 and SMA-200
The chart above shows the movement of EOS where 200 DMA has been running below SMA-20 and SMA-50. SMA-50 is running below SMA-20.
It is SMA-20 which is above SMA-50 and SMA-200. We see the token with respect to SMA’s which are 20, 50 and 200. Running of SMA-20 above the other two SMA’s results in profits to its holders.
On an average, EOS has provided returns of 25%. The area returns are marked under the trendline.
The pattern formed on a 4 hours period chart is upwards and the trend line marked shows this upwards shifting.
BUY or SELL?
An RSI oscillator is also present in the chart which shows the proper time to buy or sell the token. RSI for the last 5 hours shows the value of 54.456 and marks the neutral action.
All the MA’s show buy action shows the buy action. MA-10, MA-20. Even MA-100 and MA-200 show the buy action.
The bull/bear power has the value of -0.0194 and shows the sell action. The high/low marks the neutral action with the value of 0.0000.
The EOS-BTC pair is trailing at the level of 0.00009833 and the gain of 0.86% was seen whereas the EOS-ETH pair is at 0.001436 and the low of 0.68% was seen in the last 24 hours. The volume/market cap of the token is 0.2548 and its market dominance is 0.23%.
What does FIB suggest?
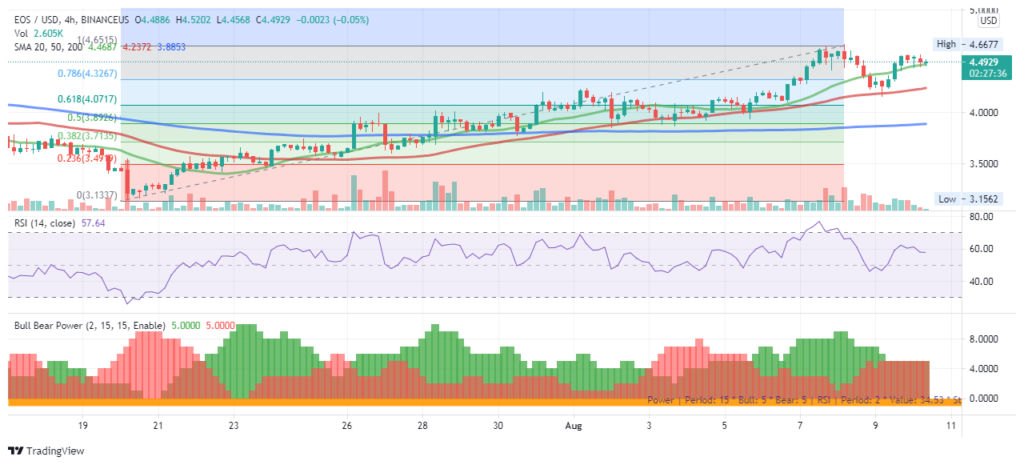
The candles forming now of coin is moving beyond the golden ratio and are making a great hike in price. It is for the first time the token has been trailing above FIB 0.618. Hike is immensely high that the coin has touched FIB 1 in yesterday’s intraday session.
Well, the token is all set to sell or buy, based on the holders and buyers opinion
Conclusion: EOS has been showing the higher highs and lower lows since 24 July.
At present the coin has been moving up and it is fine to buy now and do intraday trading.
The days range for the coin is 4.4488-4.5651. The EOS ATH is 33.89 and ATL is 0.4802.
EOS ROI (approximate return on investment if purchased at the time of launch) is 336.36%.
Technical Instruments:
Pivot: 4.4808
R-1 : 4.5010
R-2 : 4.5136
S-1 : 4.4606
S-2 : 4.4480
FIB 0.618: 4.0569
FIB 1 : 4.6537
Note:
- The unit is USD
- SMA-20: Green colour
- SMA-50: Red colour
- SMA-200: Blue colour