Covenant x402
 Pearl
 Sui
 Bitcoin
 Quack AI
 NEAR Protocol
 Quant

- Siacoin crypto trading volume at the time of writing this article is -4.37%
- SC/BTC and SC/ETH price at the time of writing this article is 0.00000039BTC and 0.0000053ETH respectively
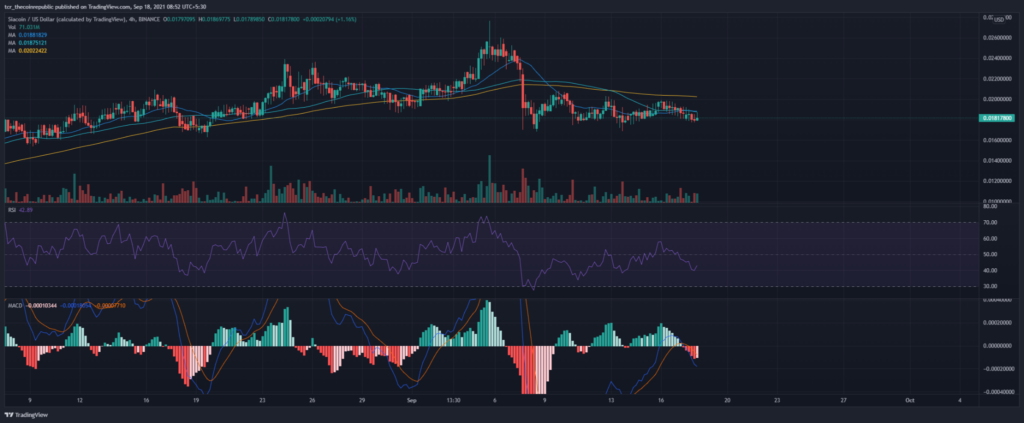
- Triple bottom pattern formed in 4hr time intervals.
LONG TERM VIEW:
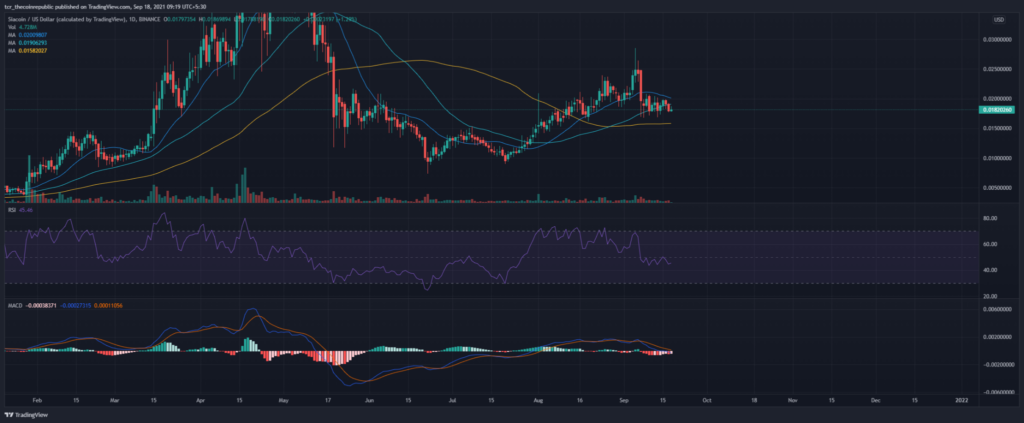
Looking at the daily chart time interval we can see that the price is now consolidating making a sideway channel and the price is near support. Looking at the MACD we can see it showing the red histograms as the MACD line is below the Signal line. Also we can see the RSI is in the neutral zone near 47 and its pointing towards the overbought zone (70), meaning the price can go both up and down.
Lastly we can have a look at the Moving Average as we can see both 20MA and 50MA is currently above the 100MA but the 20MA has started to take the dip towards the 50MA and 20MA can cross 50MA soon.
SHORT TERM VIEW:-
Looking at the 4hr time frame we can see that the triple bottom pattern has been formed. It is a very bullish pattern. Now let’s have a look at the technical indicator to confirm if it’s going to be bullish or bearish. First let’s have a look at MACD, we can see the MACD is showing red histograms, meaning the MACD line is below the Signal Line.
In addition to that we can see the RSI is in a neutral zone near 49 and the RSI is pointing upwards ( towards the overbought zone ) meaning the price is pushed up by the bulls. Lastly we can see the Moving Average, both 20MA and 50MA is currently below the 100MA which is very bearish but on the positive note we can see the 20MA has crossed 50MA and might move towards the 100MA.
CONCLUSION:-
Looking at both long term and short term, we can see the trend in the daily chart is bearish and the trend in the 4hr time frame is bullish with the triple bottom pattern. If the right amount of volume comes then the price will be pushed back to resistance and if not then the sellers can take control over the price. We can also see the change in the sentiment of people as the bulls are not willing to give up the fight in the 4hr time frame.
RESISTANCE:-$0.0208,$0.0238
SUPPORT:- $0.0177,$0.0145