Universal High Income
 Aerodrome Finance
 Lighter
 Axis Robotics
 Pearl
 Pudgy Penguins
 NEAR Protocol

- Quant price prediction suggests a rise in the long term till it holds the $100 level.
- Quant crypto price drops below 50 and 200 day EMA showcase downtrend.
- Quant price struggles to sustain above $130.00 level.
Quant Price prediction suggests a rise in the long term but it seems to be in bear grip for the short period of time. Quant price slip below the 50 and 200 day EMA showed downtrend and disturbed the sentiment of bullish traders. It also displayed the death crossover and Quant crypto witnessed a spike in the selling volume. However, the prices did not collapse and got stuck into the narrow range consolidation.
Quant price is trading at $121.00 with an intraday decline of -0.41% and 24 hour volume to market cap is 0.0083. The QNT/BTC pair is trading at 0.004278 with an intraday decline of -0.26%. The chart structure of QNT/USDT is in the consolidation phase but the QNT/BTC pair is in a strong downtrend which shows divergence. At the beginning of March, the overall crypto market witnessed selloff which negatively impacted the majority of altcoin and Quant is one of them.
Quant crypto bears attempted to break the $100 support but luckily, market sentiment improved and Quant price bounced back with the high momentum. However, the up-move halted near $134.00 and failed to give the follow up momentum.
Will Quant Price Reach $160 or Breakdown $100?
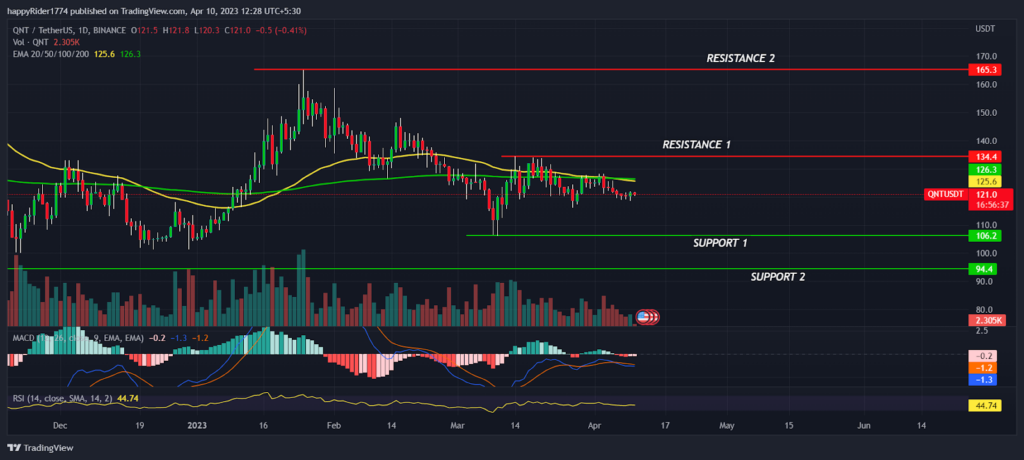
Quant price tried to hold the higher levels but sadly it began to decline by forming lower lows. Presently, the prices seem to be consolidating in the range between $106.00 to $134.00 and likely to break on either side soon. However, the probability of the upside range expansion will increase when buyers succeed to regain the price above the 200 day EMA.
Technical analysis suggests, Quant price has formed a strong base near $100 and downside seems to be limited. However, if the price drops below $100 then it may create trouble for the bullish traders.
Quant Price is in Equilibrium Zone
Quant price is in the equilibrium zone and no signs of sharp up-move or down-move is visible. However, if the market sentiment remains bullish then a short term pullback rally is possible in coming weeks. Technical indicators like MACD had generated a negative crossover, indicating mild bearishness. The RSI at 44 sloping sideways denotes prices might try to test the neutral territory in coming weeks.
Conclusion
Quant price prediction suggests a rise in the long term till price holds the support level of $100. Technical analysis says, if buyers succeed to push the price above $134.00 then the probability of reaching $160.00 will substantially increase.
Technical levels
Resistance levels : $134.00 and $165.00
Support levels : $106.00 and $94.00
Disclaimer
The views and opinions stated by the author, or any people named in this article, are for informational purposes only. they do not establish financial, investment, or other advice. Investing in or trading crypto assets comes with a risk of financial loss.