Universal High Income
 Aerodrome Finance
 Pearl
 Pudgy Penguins
 NEAR Protocol
 Axis Robotics
 Lighter

0x(ZRX) has been under a bear spell since the beginning of April. A shooting star pattern was formed after getting rejected at $0.3636. This has caused a decline in the value of the token.
- ZRX/USDT is down 0.3% today
- ZRX fell 53.60% from the resistance level of $0.3636
ZRX/USDT is trading at $0.1689 following a bearish price action over the past couple of months. After creating a swing high on 5th April a Shooting star pattern was formed. This highlighted the weakness of bulls and the bears started selling which led to the downfall. Selling continued further as the price broke a daily support level of $0.1954
Price is at important demand zone
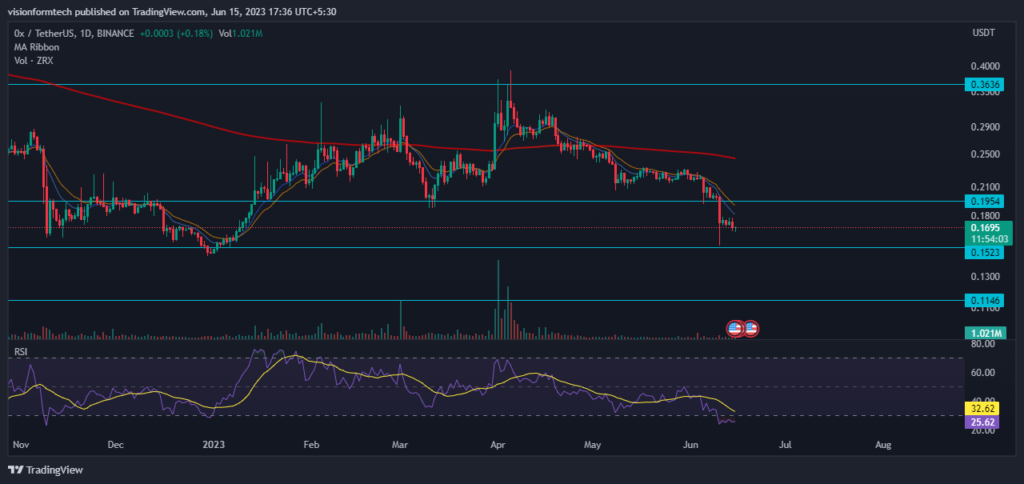
The daily chart is showing selling pressure. The price fell to its primary support and has taken a bounce of 8.5%.This bounce is still lacking a significant volume. ZRX is trapped between support and resistance and a break of these levels will decide the direction of the price. The technical indicators show that the price is in a strong downtrend and the bulls are getting burnt with every downfall. The 200 EMA is a strong resistance and the bulls should be observing it to spot a change of trend.
Although the price is in downtrend, the current level has been a zone for buying in the past. This might make investors greedy as the price is cheap and the potential upside is quite high.
Short Term Chart show consolidation
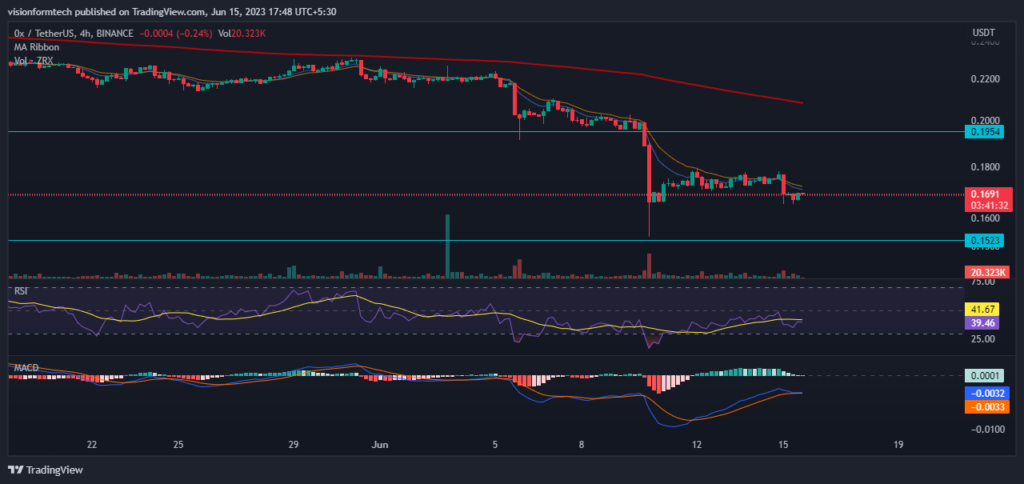
The price looks to be consolidating on the shorter timeframe. This is very natural after a big move where the sellers are booking profit and buyers are accumulating positions for a potential upside move. As the price is trading below 200 EMA , the bulls are likely to stay neutral. The price is perfectly reacting to the 9 and 15 EMA which acts as a dynamic support and resistance in trending markets.
RSI: The RSI indicator is currently at 38.94 and the RSI has crossed the MA line towards the downside which is indicating that bears are controlling the market.
MACD: The MACD indicator briefly made a bullish crossover but is already losing momentum. The Signal and MACD line are moving together which is a sign of sideways market and a bigger move could be coming anytime
200 EMA: As it is observed, on the 4hr, the price is trading below the 200 EMA(exponential moving average) which acts as a significant resistance. This is a clear indication of a downtrend where the sellers are in control and in order for a trend reversal, the price must break and trade above the 200 EMA.
Technical levels
Support Levels: $0.1523 and $0.1146
Resistance Levels: $0.1954
Conclusion
After a trading session of intense selling, ZRX has found itself between 2 important levels. These levels will decide whether to expect a reversal or further downfall. Investors are really curious to find out what is going to happen and are closely observing these levels. If a daily candle closes below the support of $0.1532, It will trigger panic selling and if a candle closes above $0.1954, this will mark the reversal. Until then the market trend remains bearish.
Disclaimer
The views and opinions stated by the author, or any people named in this article, are for informational purposes only and do not establish financial, investment, or other advice. Investing in or trading crypto assets comes with a risk of financial loss.