evmzone
 Dacity Coin
 Pudgy Penguins
 Bitcoin
 Ethena
 Zcash
 Quant


Ethereum price remained under pressure on Oct. 25 as spot exchange-traded fund withdrawals continued weighing on market sentiment.
ETH traded around $2,350 after declining from its September high near $2,804. Meanwhile, U.S. spot Ethereum ETFs recorded approximately $1.18 billion in October net outflows.
However, staking data presented a different picture, with substantial ETH awaiting entry into the validator network.
Spot Ethereum ETF Outflows Have Soared
American investors have continued dumping their ETH ETFs. Data compiled by SoSoValue shows that these ETFs have had over $1.1 billion in assets, the worst month since November last year when they shed over $1.42 billion.
This month’s outflows is a big reversal from what happened in the last three consecutive months. These funds added over $832 million in assets last month, following $1.85 billion in August this year. They added $3 billion in the previous three months.
The ETFs have now added $12.7 billion since they were approved in 2024. They now have over $14.5 billion, with BlackRock’s ETHA, Fidelity’s FETH, and Grayscale’s ETHE have the biggest market share.
Spot Ethereum ETFs have shed more outflows than other cryptocurrencies. For example, spot Bitcoin ETFs have shed $174 million this month after they added over $6 billion in the last three months. Notably, spot XRP ETFs have added $14 million this month, continuing the winning streak since March, when they shed $31 million.
The ongoing ETH ETF outflows has also coincided with those of staking. Total staked ETH tokens has dropped to 43.86 million from this month’s high of 43.87 million. The staking ratio has dropped from 36% to 35.91%, even as the reward ratio has risen to 2.7%.
Ethereum Price Has Dropped Amid Growing Risks
ETH token has come under pressure because of the ongoing macro risks in the economy. One of the risks is that US bond yields have continued rising in the past few months. The ten-year yield jumped to 5.3%, its highest level in years.
US bond yields have jumped as investors as America’s public debt has jumped to over $40.3 trillion. At the same time, there are signs that the economy has slowed down, with the US adding just 29k jobs last month. Crude oil prices have continued rising, with Brent and the West Texas Intermediate (WTI) rising to $117 and $103, respectively.
Ethereum’s network has also faced some more challenges. For example, the total value locked (TVL) has dropped to $48.55 billion from this month’s high of $53 billion. The number of active addresses has dropped to 491,870 this month from last month’s 562,500.
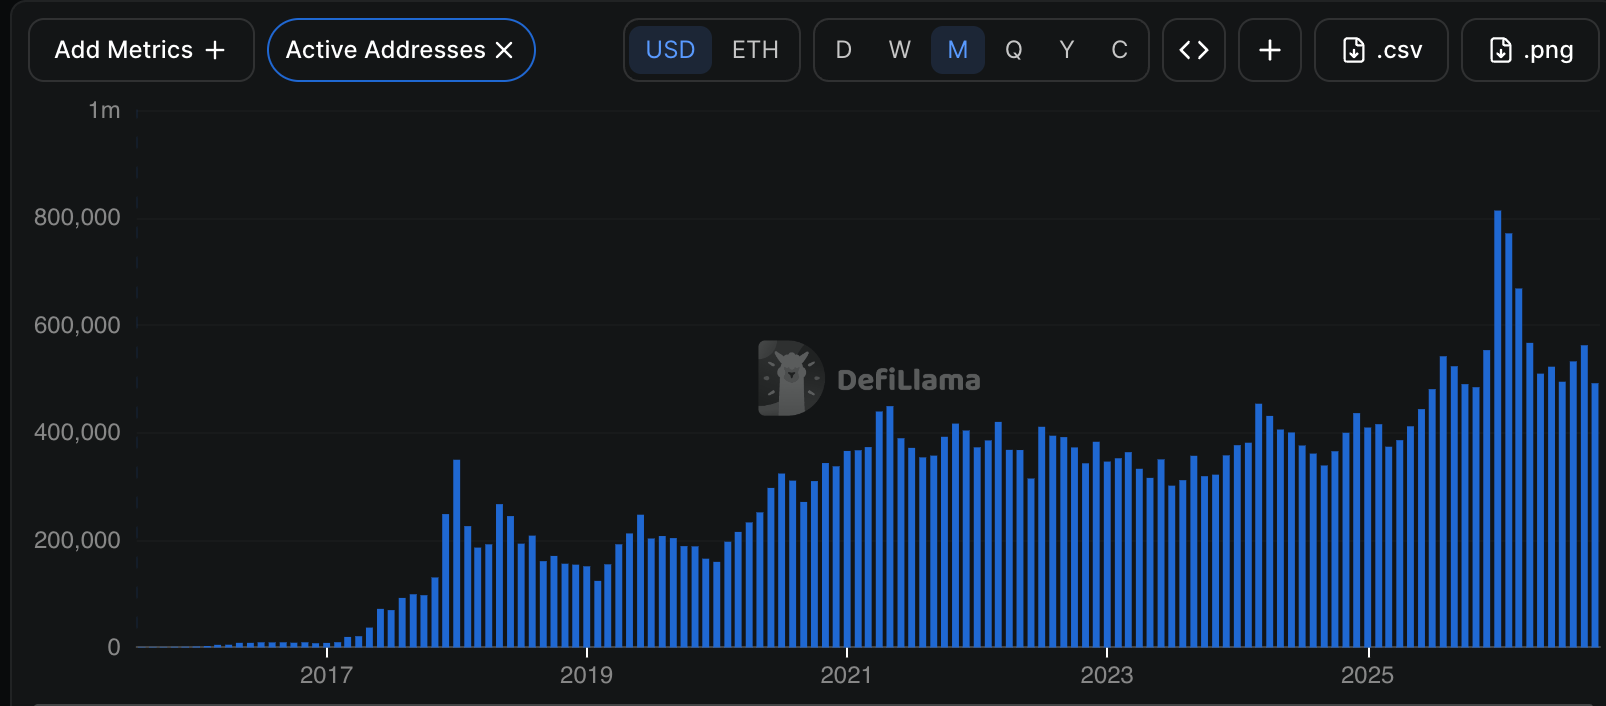
More data shows that the stablecoin market capitalization has dropped to over $144 billion from a record high of $163 billion.
ETH Price Technical Analysis
The daily chart shows that Ethereum price has slumped in the past few weeks, moving from a high of $2,804 in September to the current $2,360. A closer look at the chart shows that it has formed a head-and-shoulders pattern and is now on the neckline. This pattern normally leads to more downside.
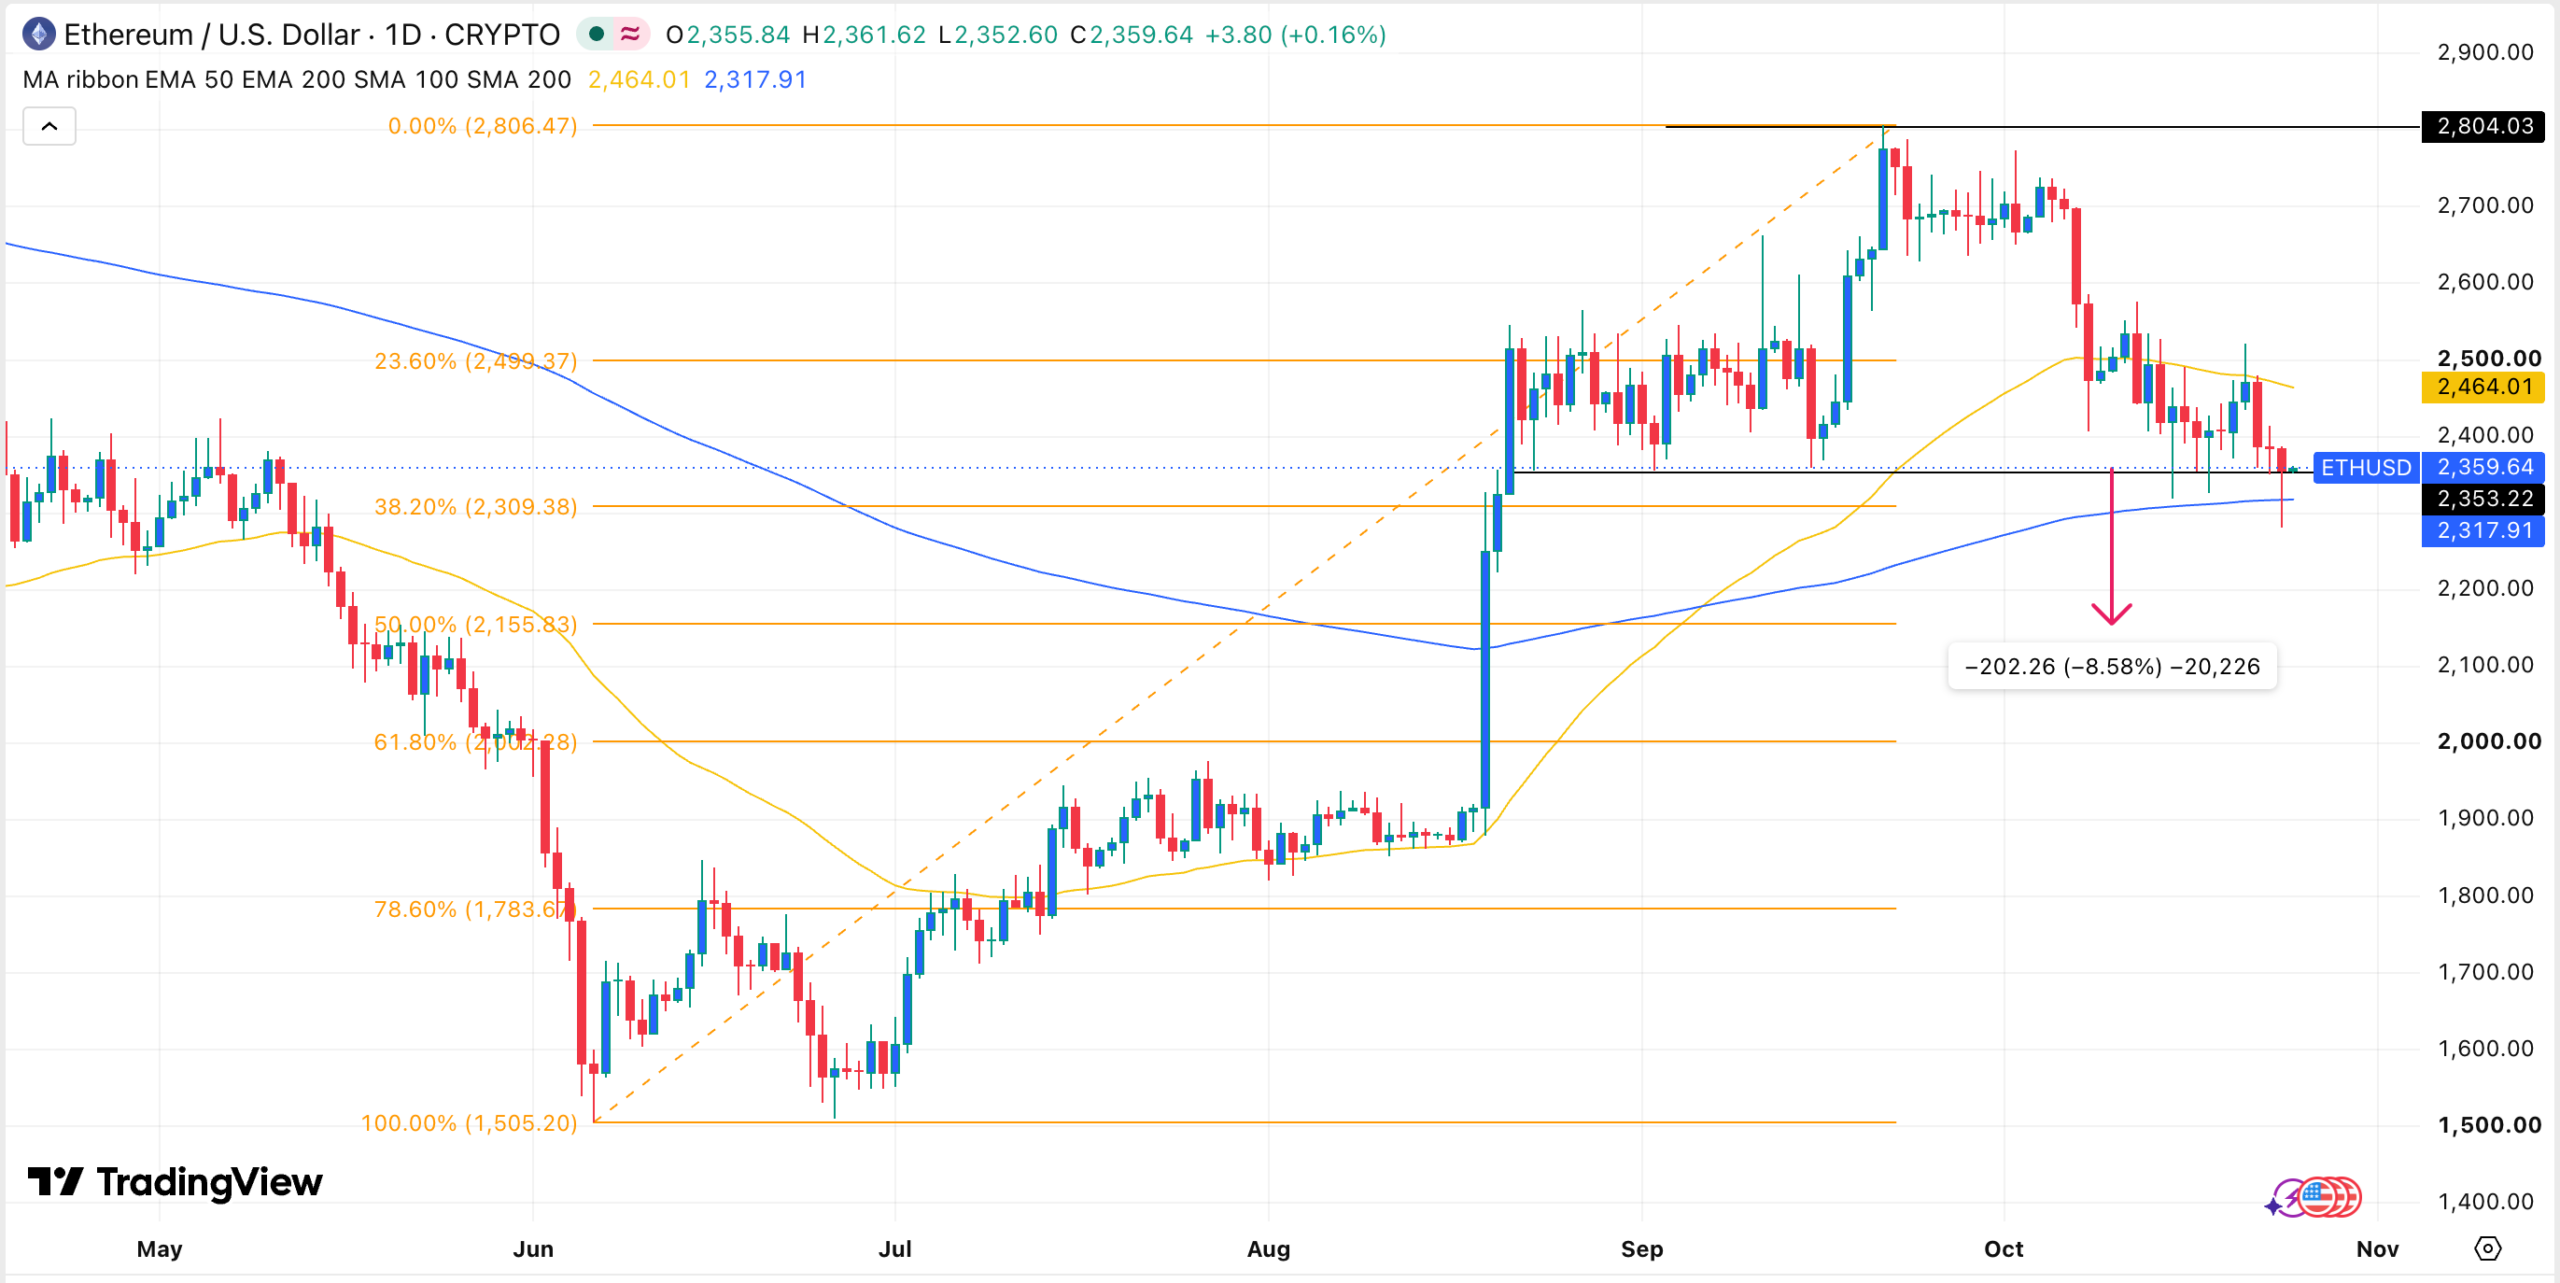
The coin has also dropped below the 38.2% Fibonacci Retracement level. It has slumped below the 50-day and 100-day moving averages. Therefore, the token will likely continue falling, potentially to the 50% retracement level of $2,155, down by 8.60% from the current level. A drop below that level will point to further downside towards the 61.8% retracement level of $2,000.
This article is for informational purposes only and does not constitute financial advice. Cryptocurrency investments carry substantial volatility and potential capital losses. Readers should conduct independent research before making investment decisions.