Super Pepe
 Super Inu
 Bitcoin
 Canton
 Pudgy Penguins
 Pearl
 Hyperliquid


Ethereum price remained near $2,250 on Oct. 31 as exchange-traded fund withdrawals deepened. U.S. spot Ether funds lost $155.7 million on Friday, according to Farside Investors.
The decline accompanied weaker decentralized finance deposits and a bearish technical assessment. However, the proposed $2,000 downside target remains conditional.
Spot ETH ETFs Had the Worst Month Ever
American investors dumped their Ethereum ETFs this month, a sign that many of them expect the coin to continue falling. Data shows that these funds shed over $1.6 billion in assets this month, the worst performance ever. Before that, the worst month was in November last year when they lost over $1.42 billion.
Ethereum ETFs shed assets in the last six consecutive weeks, with BlackRock’s EYAHA being the most affected. It was followed by Grayscale’s ETH, Grayscale’s ETH, and BlackRock’s ETHB, which have lost millions of dollars in assets in the past few weeks.
Ethereum’s performance was worse than other coins. Bitcoin ETFs shed $615 million, with most of them happening on Friday as investors reacted to the Binance hack that affected coins worth over $6.3 billion. Binance says that everything is safe and that it will cater for the losses using its large reserves.
Spot XRP ETFs added over $18.8 million in October and have had just one month of outflows since their inception. Solana ETFs lost over $143 million in assets.
Historically, ETF outflows are usually bearish because they mean that large retail and institutional investors expect the coin to fall over time.
Ethereum Price Retreat Coincided With Deteriorating Network Metrics
The ongoing ETH price retreat has coincided with the performance of other top coins. For example, Bitcoin has dropped from $87,200 in October to the current $77,225. The valuation of all tokens has tumbled from close to $3 trillion to $2.7 trillion.
One reason for this is that the Federal Reserve has hinted that it will hike interest rates in the coming months. While the bank left interest rates unchanged in this meeting, officials signaled that they will hike in the December meeting.
This view was reinforced when the US published encouraging economic numbers, which showed that the economy expanded by 3.4% in the third quarter. Ethereum and other coins tend to underperform whenever the Fed is hiking interest rates.
Meanwhile, key Ethereum metrics have continued to deteriorate, with the total Real World Assets (RWA) in the chain falling to $30.2 billion. The amount of stablecoins using the network has continued falling by 1.29% in the last seven days to $141 billion. Also, the total value locked (TVL) in the network has dropped to $43 billion from a high of $170 billion last year.
Ethereum Price Prediction: Technical Analysis
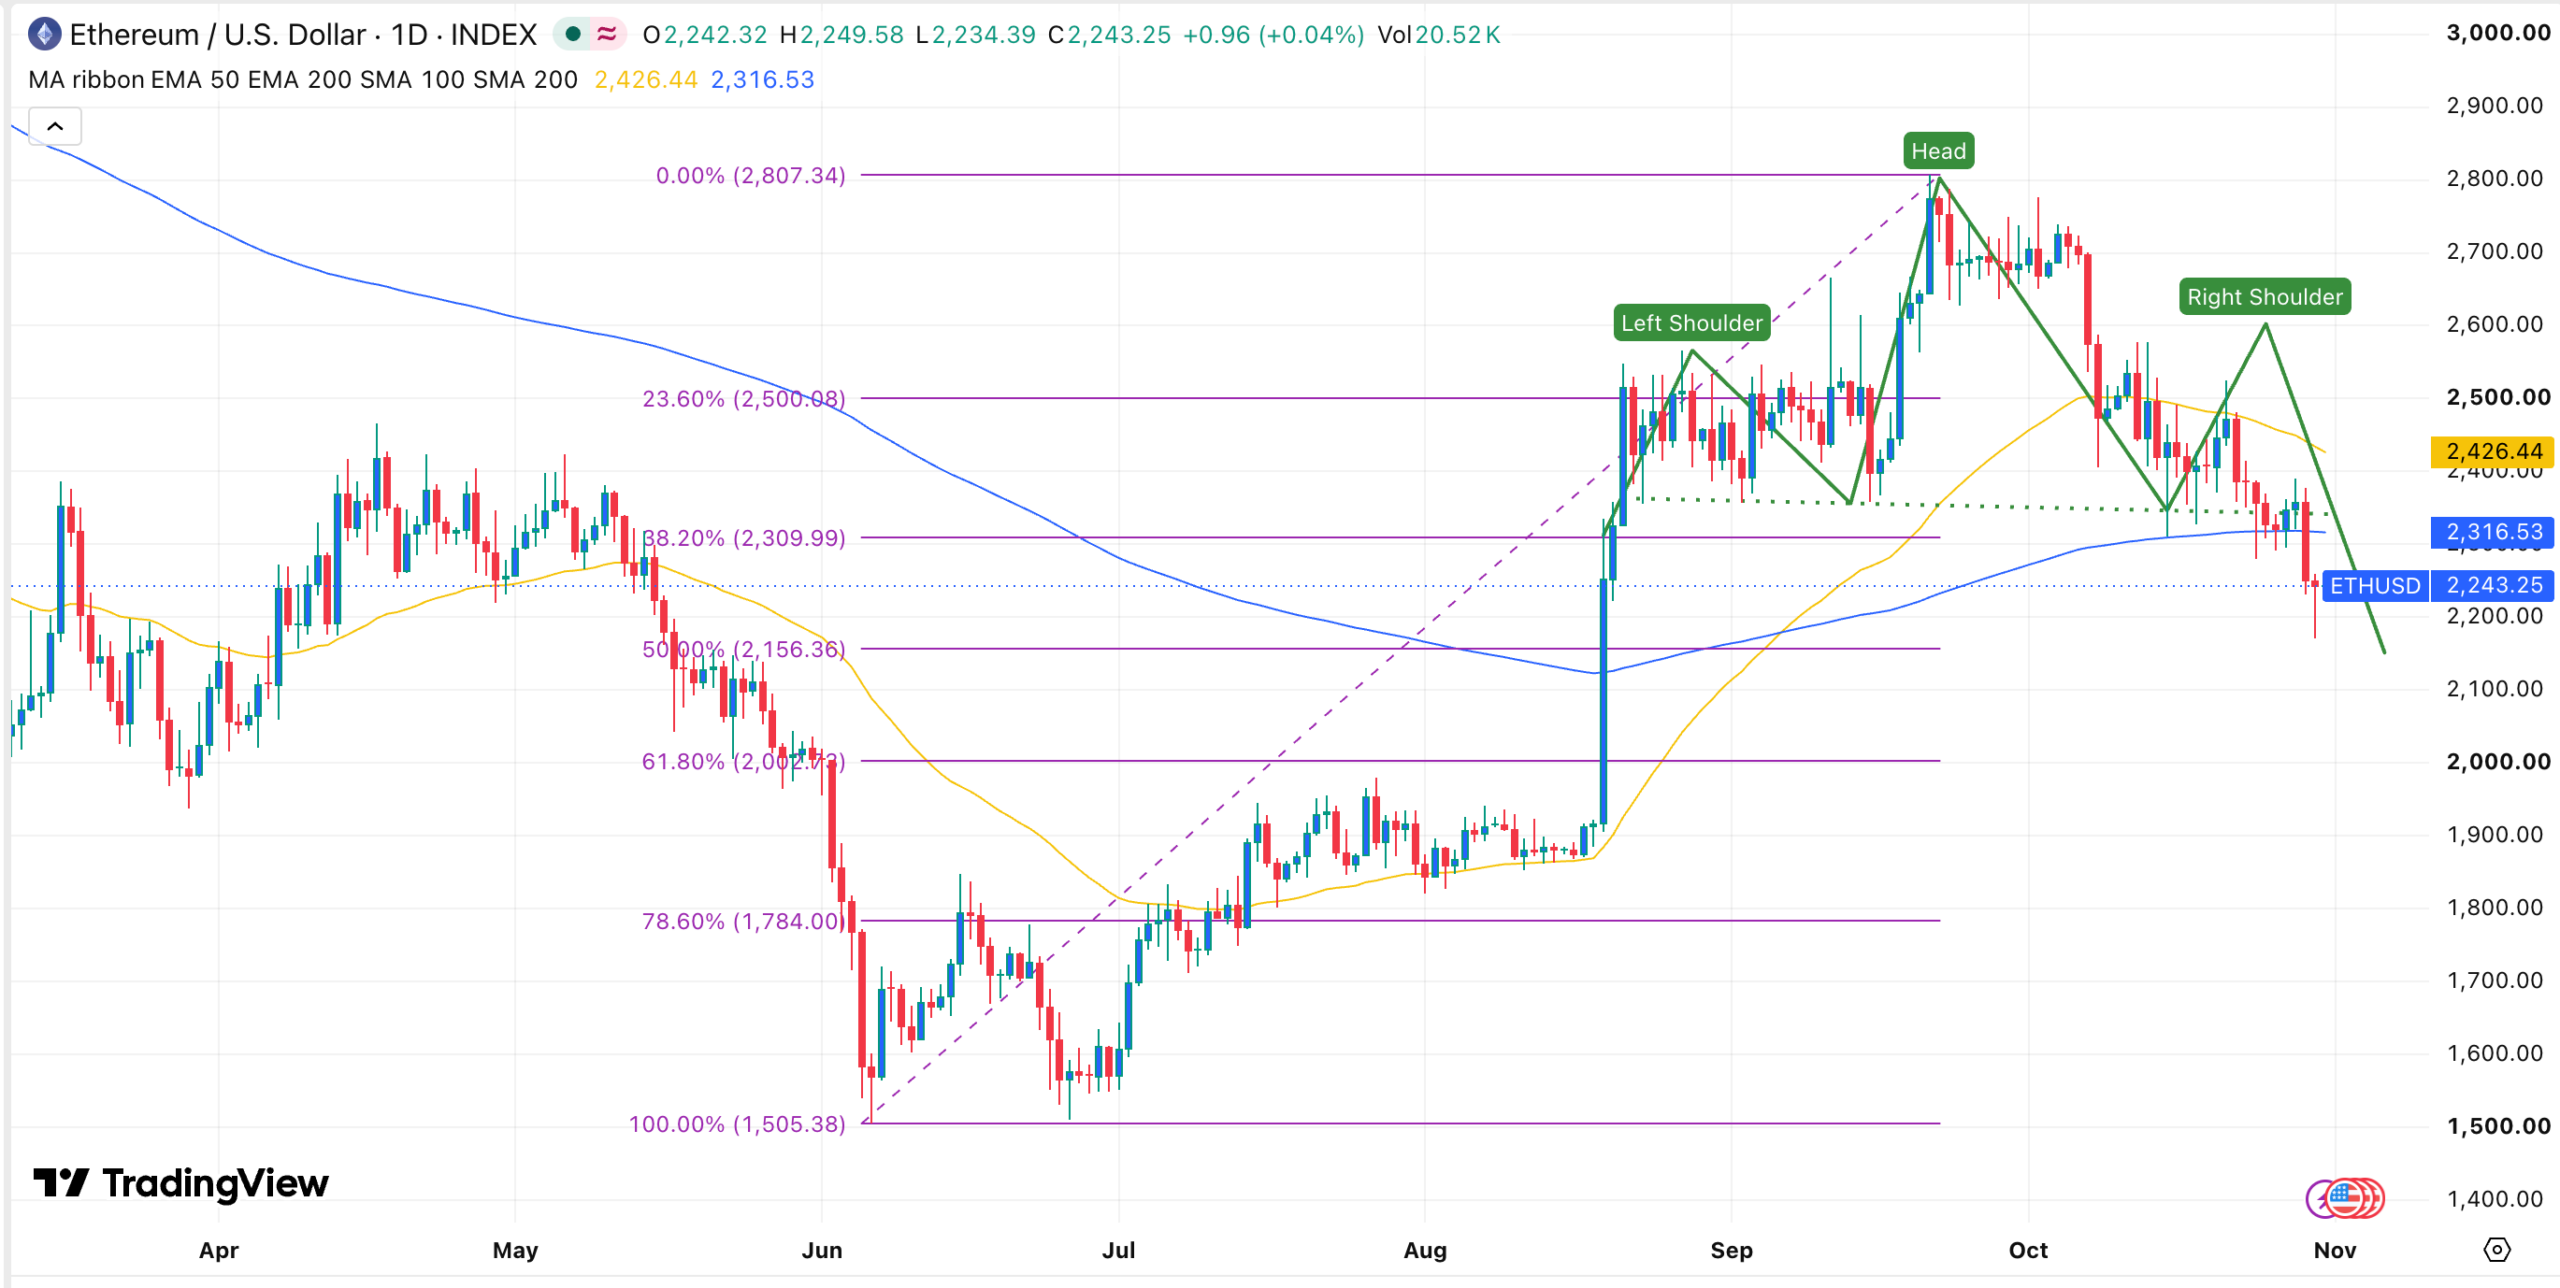
The daily chart shows that ETH price has remained under pressure in the past few months. It has slumped from $2,807 in September to the current $2,240. A closer look at the chart shows that the coin has formed a head-and-shoulders pattern, a common bearish reversal pattern.
The coin has fallen below the 38.2% Fibonacci Retracement level. It has also dropped below the 50-day moving average and the Supertrend indicator. Therefore, the token will likely continue falling, potentially to the psychological level of $2,000.
This view will be confirmed if it drops below the key support level of $2,168, its lowest level in October. On the other hand, a move above the key resistance level of $2,300 will invalidate the bearish outlook.
This article is informational and does not constitute financial advice. Cryptocurrency prices are volatile, and investors can lose capital.