 ZIG Finance
 Pudgy Penguins
 Zcash
 Bitcoin
 Pons
 Bittensor
 Kinetiq

XRP price traded near $1.06 on November 11 as the broader cryptocurrency market continued to decline. The latest losses brought XRP crypto closer to the $1 support zone, where a potential third macro bottom is taking shape. Long-term projections still point to higher prices, although traders have yet to confirm a reversal. Heavy liquidations and selling pressure remain obstacles to a recovery.
XRP Price Tests $1.00 Support
XRP price has recorded larger losses than several major cryptocurrencies since November 4. Figures shared by market analyst EGRAG Crypto put XRP’s decline at 23.4%, compared with 18.2% for Ethereum, 17% for Solana, and 10.4% for Bitcoin. XRP also lost more than 15% over seven days, while its monthly decline approached 25%.
The selloff brought XRP toward a support band between $1.00 and $1.04. This area sits near a rising trendline that has supported several previous price recoveries. XRP price now faces a test of whether buyers can defend that structure.
A sustained break below $1.00 would shift attention toward $0.99, while a recovery would bring $1.15 and $1.25 into focus. XRP crypto also trades below its 20-day, 50-day, and 200-day moving averages.
XRP Price Prediction: Triple Bottom and Cup-and-Handle Setups
Long-term technical projections place XRP price near a possible third bottom along an ascending support line. Earlier tests of that line occurred around 2020, 2022, and 2024. The latest pullback has returned XRP crypto toward the same broader structure.
The proposed triple bottom remains incomplete until price stabilizes and confirms an upward move.
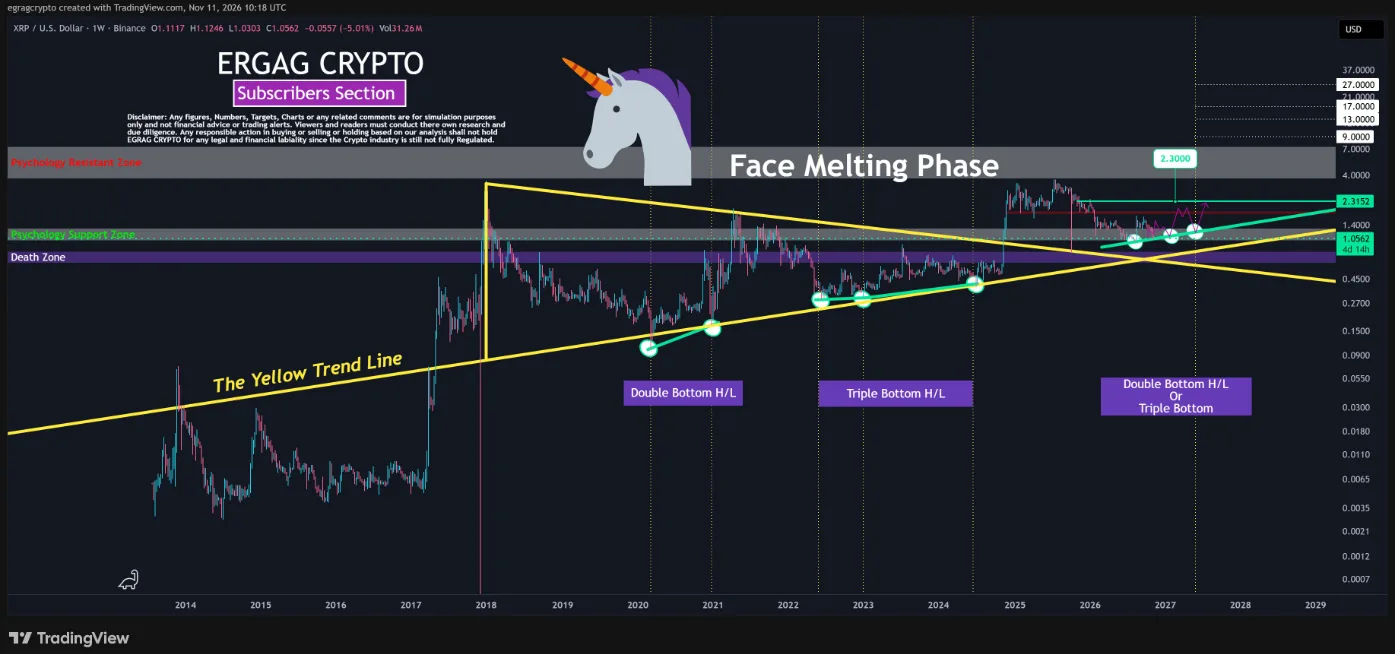
EGRAG’s macro forecast identifies $13, $17, and $27 as possible Fibonacci targets following a confirmed recovery and subsequent breakouts. Those figures represent long-term scenarios rather than near-term price expectations.
A separate analysis from ChartNerd identifies an eight-and-a-half-year cup-and-handle pattern, with repeated tests of a Gaussian trend indicator. That XRP price prediction marks retracement levels near $0.89 and $0.74 as lower reference areas. The projected cup-and-handle formation also needs a breakout before it can confirm a larger advance.
Oversold XRP Momentum Awaits Bullish Confirmation
The two-month stochastic relative strength index has returned to an extreme oversold region. Both oscillator lines now sit near the bottom of their range and have started flattening.
Similar conditions developed in 2019–2020 and 2022–2023 before XRP later experienced sustained price advances. Those historical comparisons do not establish when the current decline will end.
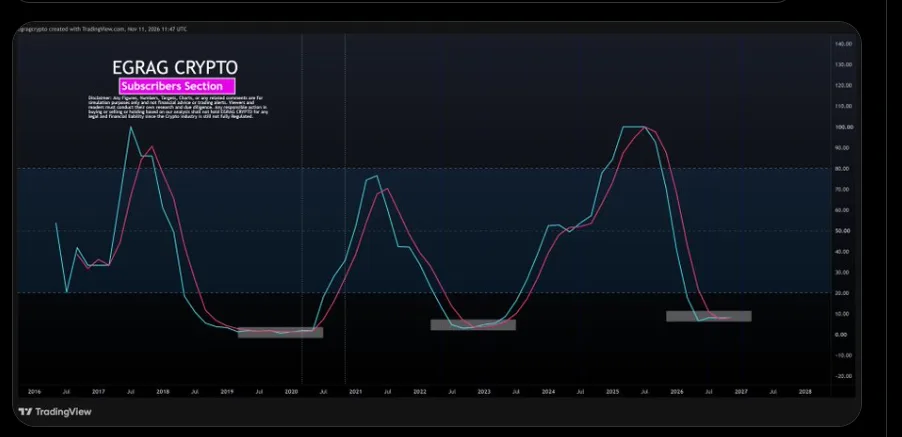
The momentum indicator offers several levels to monitor. A bullish crossover between the two lines would provide an early sign of improvement.
A move back above 20 would offer further evidence of recovering momentum, while a reading above 50 would mark a stronger shift. For now, the oscillator remains near its lows, and the proposed bullish reversal still lacks confirmation.
Liquidations and Holder Selling Increase Downward Pressure
Derivatives activity has added selling pressure during XRP’s recent decline. CoinGlass recorded nearly $39 million in XRP long liquidations compared with approximately $366,000 in short liquidations.
Exchanges closed leveraged long positions as prices fell, adding sell orders during an already weak trading period. Long positions accounted for most liquidations that day, though the figures alone cannot explain the full market decline.
Selling by early XRP holders offers another possible explanation for the token’s relative weakness. Some long-term investors still hold gains from earlier purchases and may have reduced their exposure.