Bitcoin
 Aerodrome Finance
 Zerebro
 Starknet
 Zama
Zama Pearl
Pearl ZKsync

Key Insights:
- Ethereum’s price action closely mirrors Bitcoin’s 2020 breakout from an ascending triangle pattern.
- A breakout above $4K could trigger a strong Ethereum rally similar to Bitcoin’s past cycle.
- Historical crypto cycles suggest Ethereum may be poised for a significant price surge.
Ethereum price recent trends show strong similarities to the Bitcoin price 2020 Q3 breakout period as whales continue to purchase large amounts of ETH. Analysts note that if Ethereum breaks through the $4K mark it will generate a strong upward trend. This indicates that its market value will significantly increase as Bitcoin did during its breakout.
Ethereum Price Mirrors Bitcoin 2020 Q3 Performance
Analyst TedPillows noted that Ethereum price behavior matches the Bitcoin 2020 breakout through ascending triangular patterns. The technical pattern indicates that Ethereum is preparing for a significant market shift. Ethereum is currently in a consolidation stage which could create a similar growth pattern as Bitcoin experienced in the past.
In addition, TedPillows suggests that Ethereum needs to surpass $4,000 to begin a significant price increase. The current resistance barrier at $4000 marks an important threshold that Ethereum must break for it to follow Bitcoin’s third cycle pattern.
Furthermore, he pointed to historical crypto cycles as evidence that Ethereum may be poised for a significant price surge. The analyst relies on Bitcoin historical behavior to argue Ethereum will exhibit matching price growth after breaking through the $4,000 threshold. The analyst predicts Ethereum will generate substantial investor returns because of its ongoing development which includes scalability upgrades.
Ethereum Whales Continue to Accumulate ETH
More so, analyst Ali Martinez has noted that Ethereum whales purchased 140,000 ETH during the last 24 hours. Such a significant buying pattern from major investors indicates their optimistic outlook for Ethereum price growth.
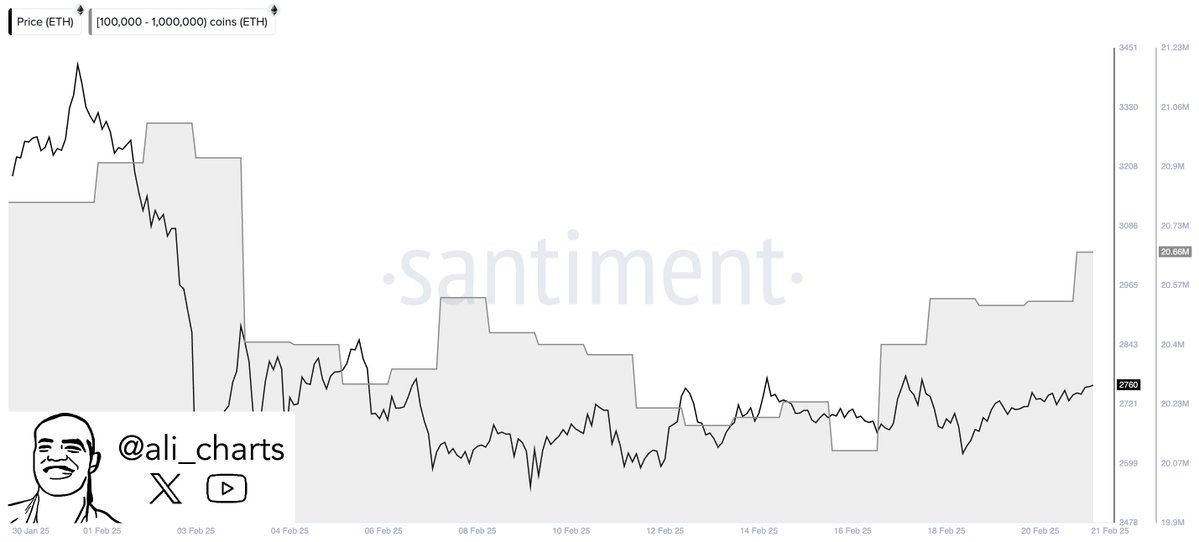
Consequently, the strategic purchasing occurs when ETH prices exhibit stabilizing behavior. The heightened whale activity suggests these market players are strategically building their positions because they expect a major price movement for Ethereum.
Ethereum Technical Analysis
On the technical indicators, the MACD (Moving Average Convergence Divergence) indicator displays a MACD line at 4.90 while the signal line sits at 9.42 with the histogram at 4.52. The current MACD indicator position shows Ethereum located in a mildly bullish territory since the MACD line remains under the signal line. The positive histogram reading implies there might be hidden market momentum. A crossover of the MACD line over the signal line points towards an upcoming bullish market trend.
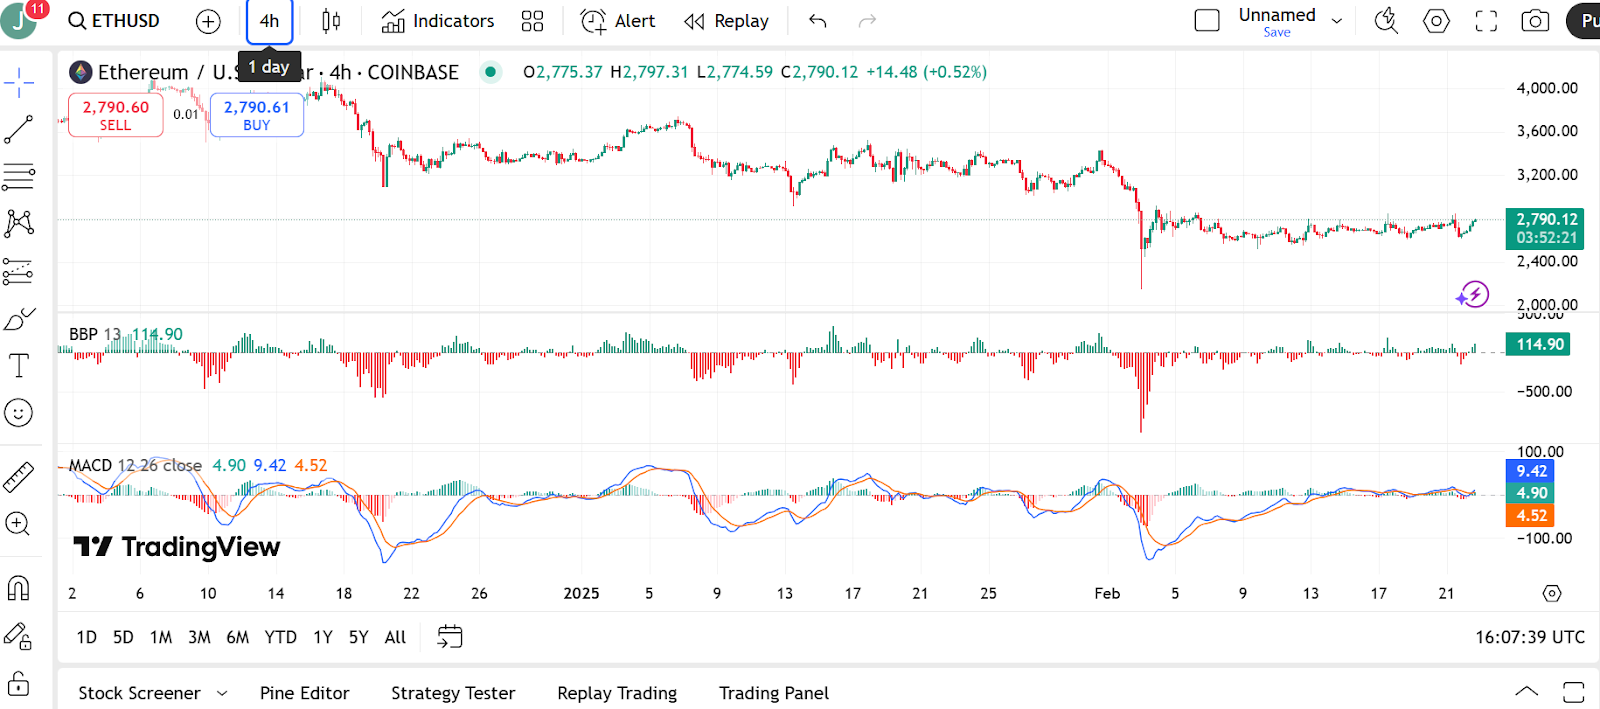
Additionally, the Bull Bear Power indicator (BBP) for Ethereum displays a strong bullish trend by sitting at 114.90 right now. The indicator reveals the market’s buying power stands stronger than its selling power demonstrating that bulls currently dominate market control. The histogram bars plotted above the zero line also exhibit buying pressure which reinforces the current bullish trend.
At the time of writing, Ethereum price is trading at $2,783.99, showing a 2.47% increase in the last 24 hours. The price has seen a strong upward movement, breaking past key resistance levels, signaling bullish momentum.
Disclaimer
In this article, the views, and opinions stated by the author, or any people named are for informational purposes only, and they don’t establish the investment, financial, or any other advice. Trading or investing in cryptocurrency assets comes with a risk of financial loss