
 streamoors
 IGNITION
 Sword Inu
 no crying in the casino
 Altai the Tiger
 Pearl
Pearl Pudgy Penguins

Key Insights:
- Bitcoin whales offloaded 6,813 BTC over the past week, marking the largest outflow since July 2024.
- Short-term Bitcoin traders declined by 3.72%, indicating reduced speculative activity in the market.
- STH MVRV metric nears critical levels, historically signaling potential price reversals in Bitcoin trends.
Bitcoin price remains under pressure as economic conditions and sell-offs among institutional investors weigh on the OG crypto. Analyzing BTC market data, one can see that its has been experiencing a rather sharp decline during the past week with a decrease on several consecutive days. On the other hand, there are specific signals on-chain that have shown changes in trends depending on the categories of Bitcoin holders.
Bitcoin Price Drops Below Key Levels as Investors Exit
BTC has experienced sustained downward pressure, exacerbated by controversial economic policies and growing concerns about inflation. These factors have led to massive outflows from Bitcoin exchange-traded funds (ETFs) and a broader sell-off among investors.
On Monday the BTC shed $94 000 and continued to decrease to $86 000 the following day. This decline was carried forward to the Wednesday, entering a new week with the BTC at $82,100. At the time of writing, Bitcoin is valued at $84,664.23, which is (-1.82%) down on the day and (-13.37%) down on the week.
For instance, during this period of weakness, Bitcoin whales were observed to have been dumping their holdings frequently. As reported by Santiment, long-term holders of BTC, or those possessing 10 or more coins, sold roughly 6,813 BTC in the last seven days. The outflow was the biggest monthly outflow since July 2024 and indicates that major holders are holding a less bullish stance.
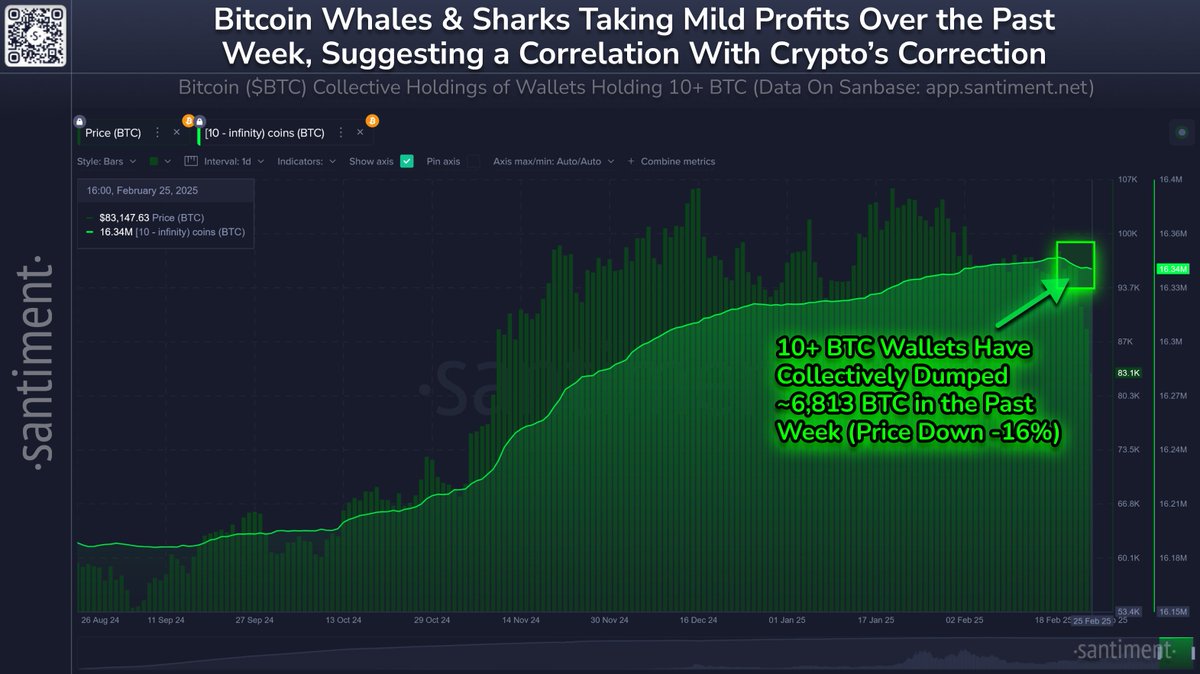
Usually, the whale wallets’ activity has been related to price movements where buying occurs before an increase in the price and selling after, results in a decline.
Bitcoin Holder Trends Show Diverging Patterns
Further data from IntoTheBlock shows the shift in ownership between various categories of Bitcoin owners compared to regular whales. Holders are classified as LTP holders (hodlers), mid-term holders (cruisers) and short-term trading oriented individuals, who behave differently in response to market conditions.
Long-term Hodlers, which are characterized by those who hold a least BTC for one year now remain high. The overall number of shares increased by of 0.98% which proves that the company continues to attract new investors during the period of market fluctuation. In the past, hodlers have continued to hold BTC despite fluctuations in its value and have tended to buy BTC at a low price.
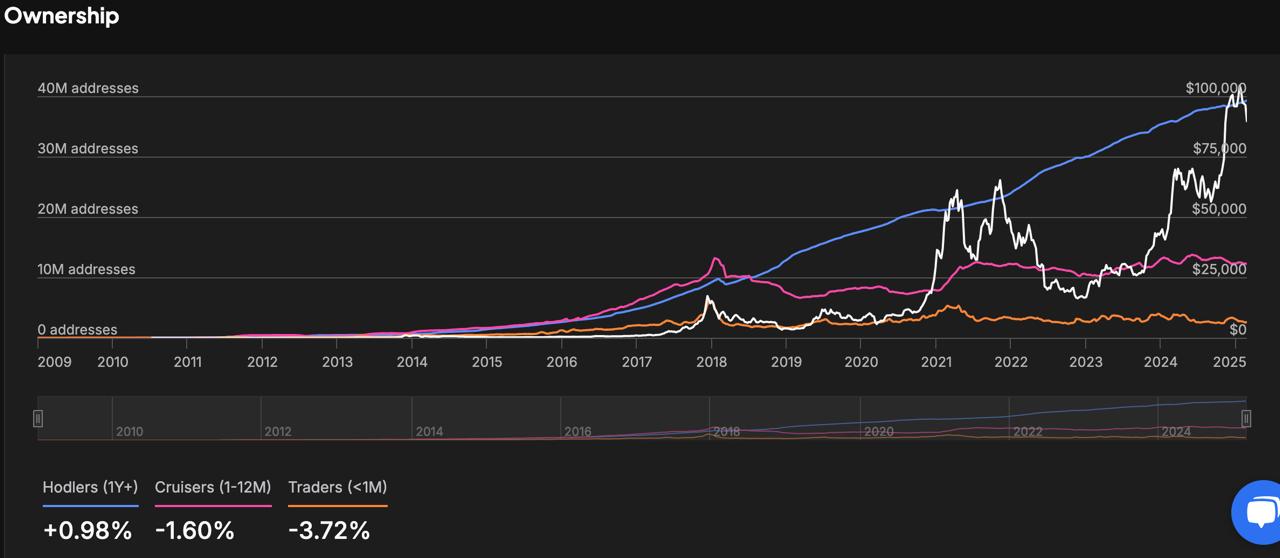
Concurrently, there is a 1.60% drop in the number of cruiser wallets holding BTC for one to twelve months. This rotation indicates that the mid-term holders are either long term or exit positions in the market. Cruiser activity is generally more common during the periods of bull markets and less so in conditions of volatility.
In the short term, traders who are holding the cryptocurrency for a period less than a month have been considerably worsted by 3.72%. This has contributed to the decline, hence acting as a hint for a possible cooling phase, or a phase where market participation slows down. Less trading activity is sometimes found in a relationship with a decrease in short-term volatility.
Possible Reversal Zones For Bitcoin Price
Additional insights from CryptoQuant focus on Bitcoin’s Short-Term Holder Market Value to Realized Value (STH MVRV) ratio. This indicator, ranging over 155 days attempts to show whether there are short-term holder who may be in profit or loss area, which may signal reversal.
Currently, STH MVRV has approached lower levels. When this metric drops below 1, it suggests that short-term holders are holding BTC at a loss. Historically, values below 0.9 have aligned with local Bitcoin price bottoms, marked by purple circles on CryptoQuant’s analysis.
Furthermore, historical price trends indicate that corrections within a Bitcoin bull cycle are not unusual. CryptoQuant’s CEO Ki Young Ju highlighted that a 30% correction in a Bitcoin rally is common.
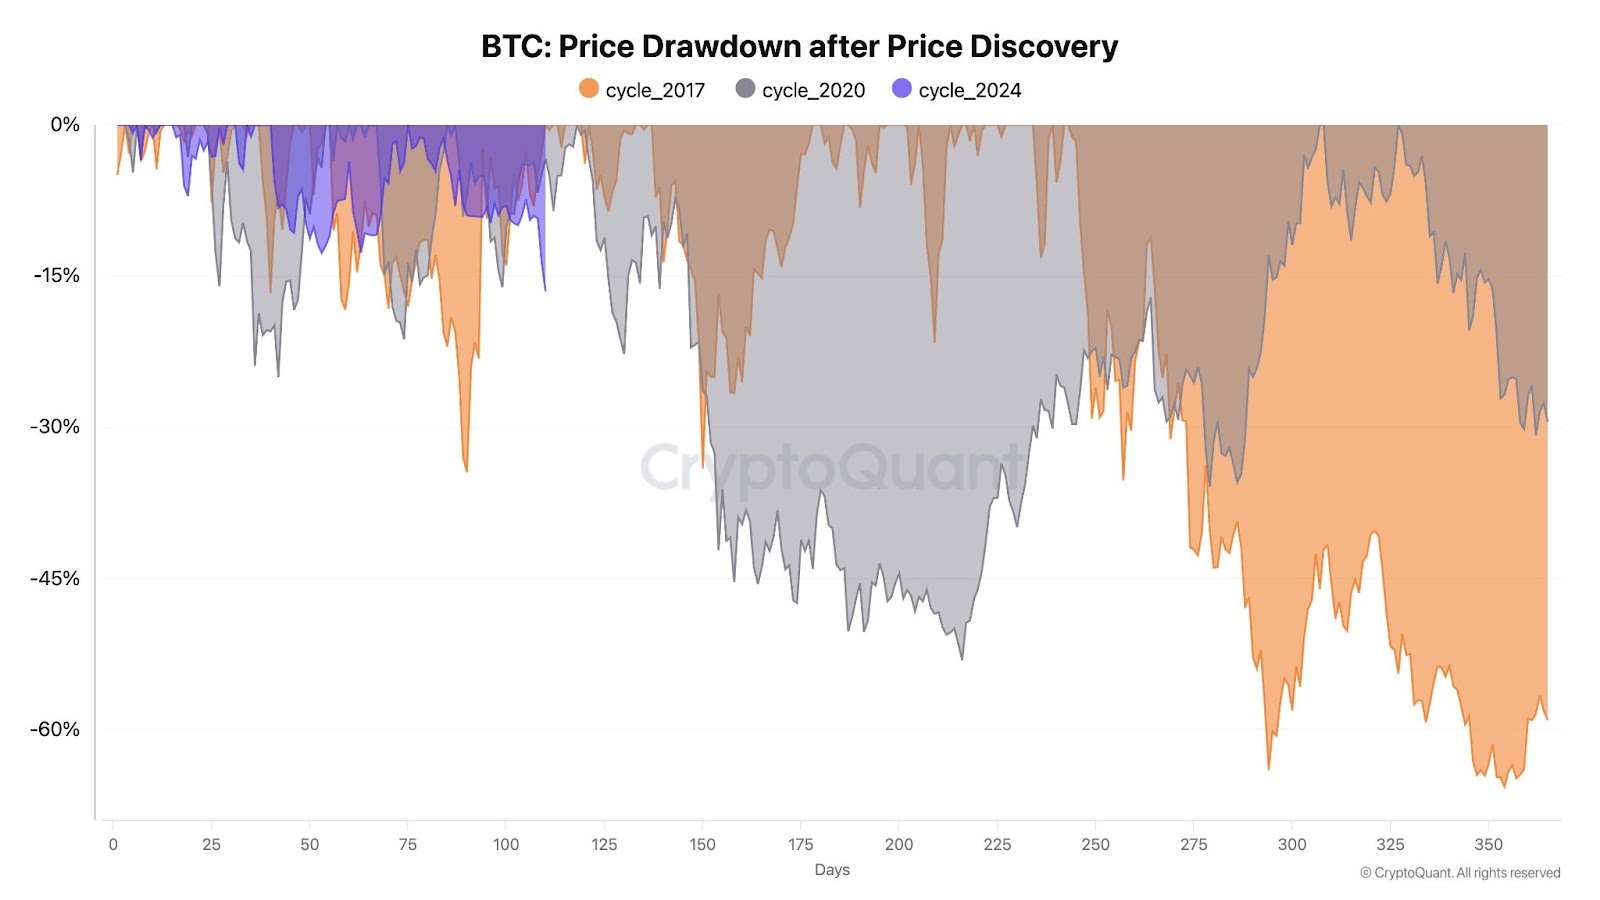
In 2021, Bitcoin price saw a 53% decline before recovering to a new all-time high. Data suggests that sharp corrections often occur before further upward momentum in a bullish market.
Disclaimer
In this article, the views, and opinions stated by the author, or any people named are for informational purposes only, and they don’t establish the investment, financial, or any other advice. Trading or investing in cryptocurrency assets comes with a risk of financial loss.




