
 streamoors
 IGNITION
 Sword Inu
 no crying in the casino
 Altai the Tiger
 Pearl
Pearl Pudgy Penguins

Key Insights:
- AVAX is nearing a crucial demand zone, indicating potential support.
- The bearish trend may be ending as momentum shifts toward a reversal.
- Traders are watching key price levels for a possible breakout.
Avalanche (AVAX) price is approaching a key demand zone, and traders are watching for signs of a potential trend reversal. After several months of declining prices, the latest chart patterns and technical indicators suggest the early stages of market stabilization.
Recent trading activity shows Avalanche gaining momentum, with analysts pointing to potential breakout levels. Market sentiment remains cautious, but some experts believe the asset could be nearing a turning point.
AVAX Price Approaching Demand Zone After Bearish Phase
Since late 2024, AVAX price have been in a very bearish trend. Recent price actions have created several lower highs and lower lows. Avalanche is close to a demand zone between $14 and $17, which previously was acting as support.
Requests for this zone are receiving renewed interest from buyers. Market analyst LLuciano_BTC shares that AVAX price is gradually bottoming out at this zone. According to the analyst, the price stabilizes as momentum shifts from selling to buying pressure.
Falling Wedge Pattern and Bullish Setup
AVAX displayed a falling wedge pattern on the daily chart, which is usually a bullish reversal pattern. The downward Avalanche price movement has consistently made lower highs and lower lows.
On the other hand, it closed in a wedge as the price reduced. Breaking past the upper resistance line might mean initiating a fresh upward move.
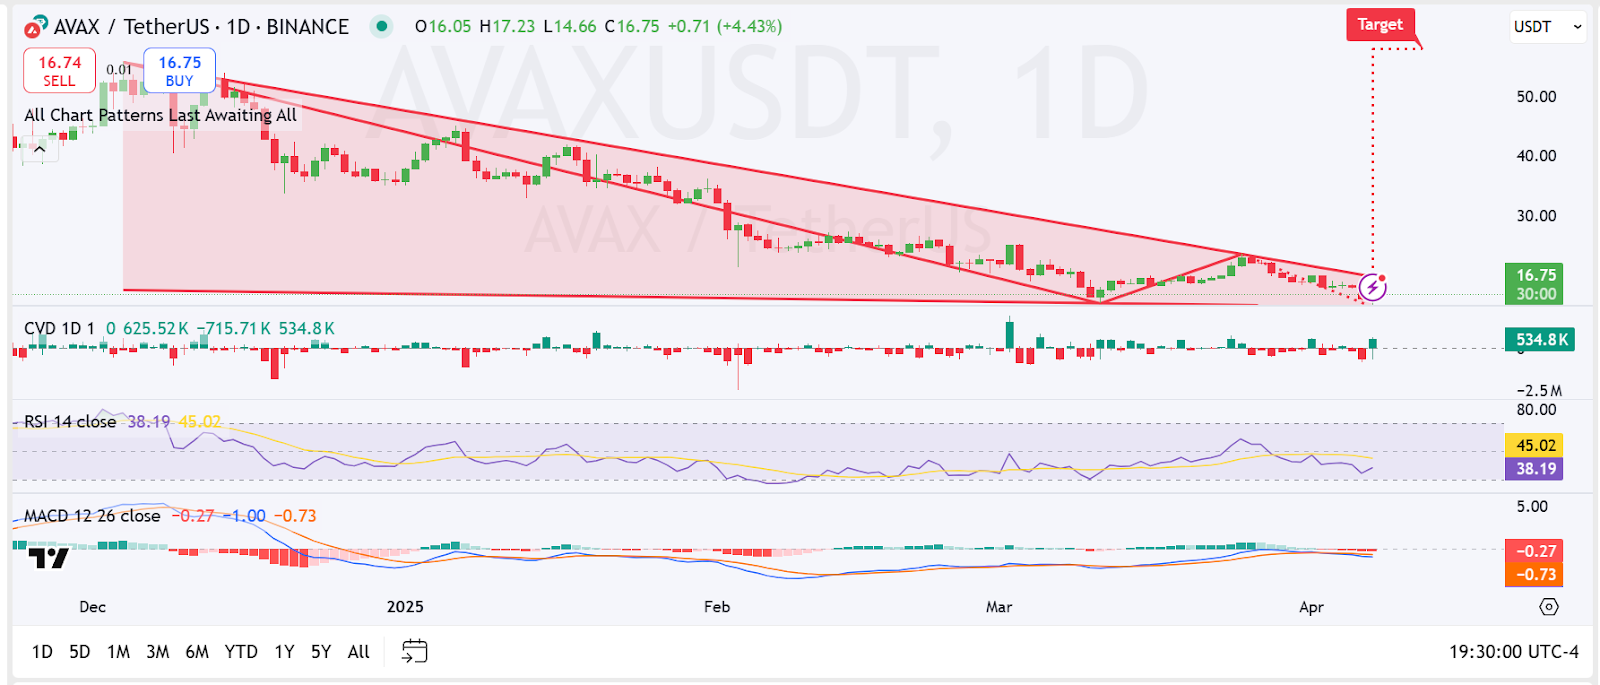
AVAX price gained 4.43% and closed at $16.75 during the most recent trading session. The price ranged between $14.66 and $17.23. This move took the token nearer to the resistance of the falling wedge.
If Avalanche price breaks above this level, it could aim for a short-term target in the $25–$30 range. Further upward movement could potentially reach the $50 mark over time.
Momentum indicators are showing signs of a potential reversal. The Relative Strength Index (RSI) was at 38.19, below the neutral 50 line but rising slowly.
The moving average convergence divergence (MACD) was negatively trending. Still, the gap is narrowing, reflecting bearish momentum, which is losing strength.
Meanwhile, Cumulative Volume Delta (CVD) comes at a positive value of 534.8K. It is a sign of the increased buying pressure.
Analysts See Bullish Potential Despite Bearish Sentiment
Although the broader market sentiment remains bearish, analysts see potential in AVAX price. They maintain a bullish outlook on its long-term performance.
As per XBitcode, the 3-month chart for Avalanche is “the most bullish in a decade.” Earlier this week, the token was still trending downward.
However, the token consolidates within a symmetrical triangle pattern in the higher time frame. It was supported strongly by the $14–17 range.
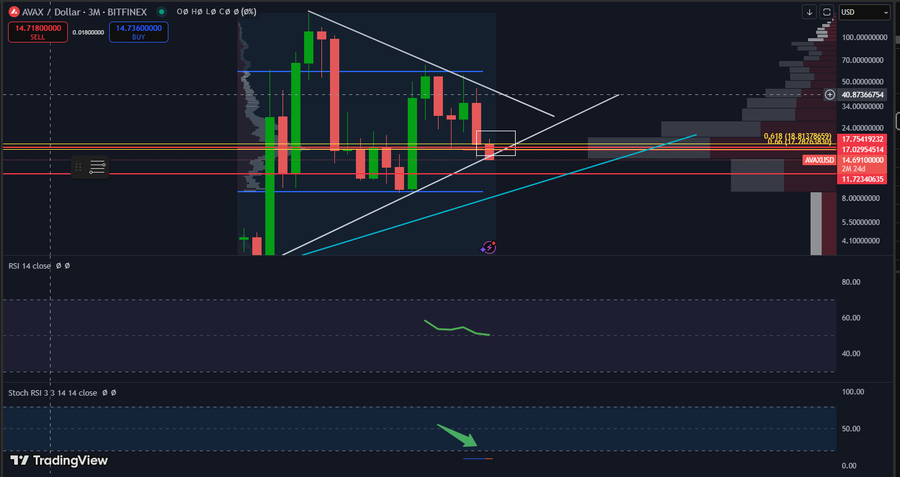
The RSI and the Stochastic RSI indicated a reversal from oversold conditions. Besides, AVAX also keeps above the 0.618 Fibonacci retracement level. This may act as support if the AVAX price stabilizes further.
Over the past 24 hours, AVAX’s future open interest has also grown by 1.41% to $177.8 Million. This figure is due to perpetual contracts, with the highest share made by dYdX, Bybit, OKX, and Uniswap.
Thus, the rise in open interest indicates returning trader participation. This helps sustain further momentum and break out a price.
AVAX Price Forecasts and Market Performance
Per current forecasts, Avalanche is likely to drop by 3.45%. Also, the price could drop to $19.55 by April 27, 2025. The fear & greed index stands at 26, displaying fear, and the technical indicators still positively show bearish sentiment.
However, AVAX had 16 green days out of 30 days in the past month regarding its 53% performance and 8.20% price volatility.
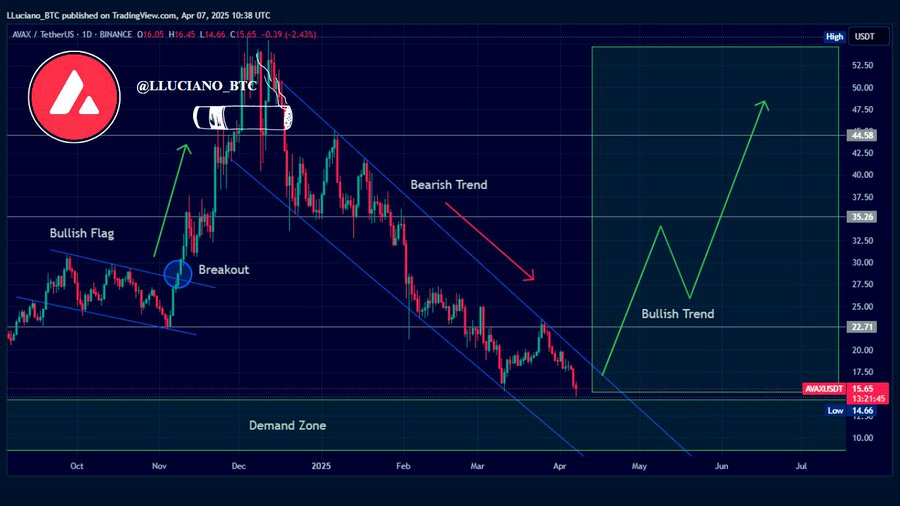
Analyst LLuciano_BTC speculates that the price could be an accumulation area at the current price zone. AVAX price may increase to $45 – $50 if the demand zone holds and the token ruptures the descending trendline.
This setup reflects previous breakout patterns that followed extended bearish trends. Traders are closely watching the price action for confirmation of a reversal.
A breakout above the falling wedge and sustained momentum above $17 could start a new trend. Until then, the demand zone between $14 and $17 remains the key area to monitor.
Disclaimer
In this article, the views and opinions stated by the author or any people named are for informational purposes only, and they don’t establish the investment, financial, or any other advice. Trading or investing in cryptocurrency assets comes with a risk of financial loss.




