streamoors
 Celestia
 IGNITION
 Injective
 Pudgy Penguins
 LayerZero
 Quantus

Key Insights:
- Bitcoin is seeing a bullish trend, driven by rate cuts and whale activity.
- A weekly TD Sequential buy signal suggests a potential rise to $88,000.
- Open interest and institutional interest show increasing market confidence.
Bitcoin price has been showing strong bullish momentum, driven by a combination of market factors including rate cuts and increasing whale activity. The asset has been displaying signs of potential price appreciation as it continues to gain interest from institutional investors.
Bullish Signs: TD Sequential Buy Signal and Whale Activity
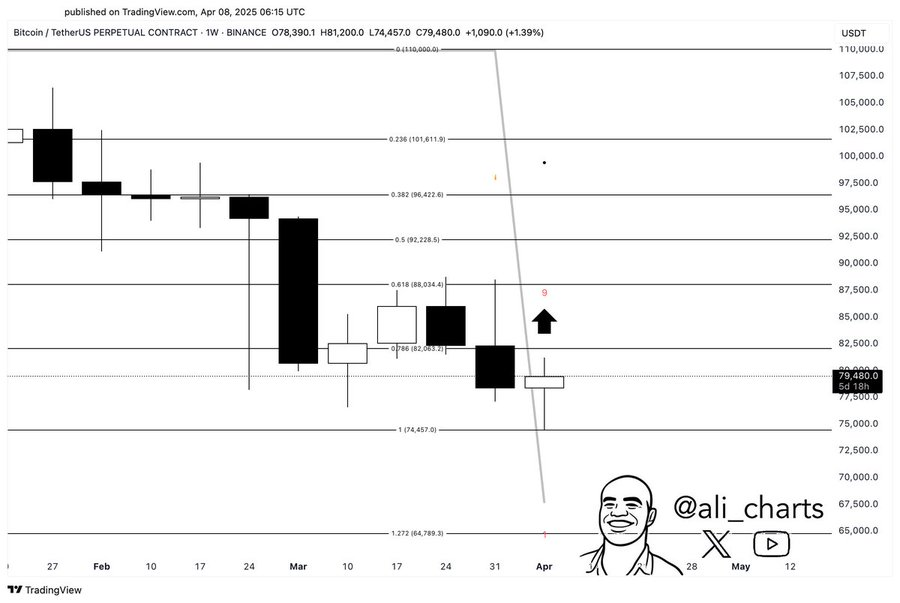
A TD Sequential buy signal is a notable indicator of Bitcoin’s potential for upside movement. Market analyst Ali believes Bitcoin has printed a weekly TD Sequential buy signal and could rise to $88,000.
A buy signal typically marks a shift from bearish to bullish sentiment. If Bitcoin holds above $74,500 and breaks $82,000, it may confirm the start of another leg upward.
Whale activity has been playing a significant role in Bitcoin’s surge. Over 1,700 whale transactions, each valued at over $1 million, have been recorded, indicating that large investors are positioning themselves for a potential rally. These large transactions are often seen as a sign of institutional confidence in the asset, as whales tend to make moves only when they are confident about the market direction.
Bitcoin’s rate cuts and institutional interest support it.
Rate cuts have also bolstered Bitcoin’s upside case. Analysts say looser monetary policy encourages liquidity, pushing investors toward high-risk assets like Bitcoin.
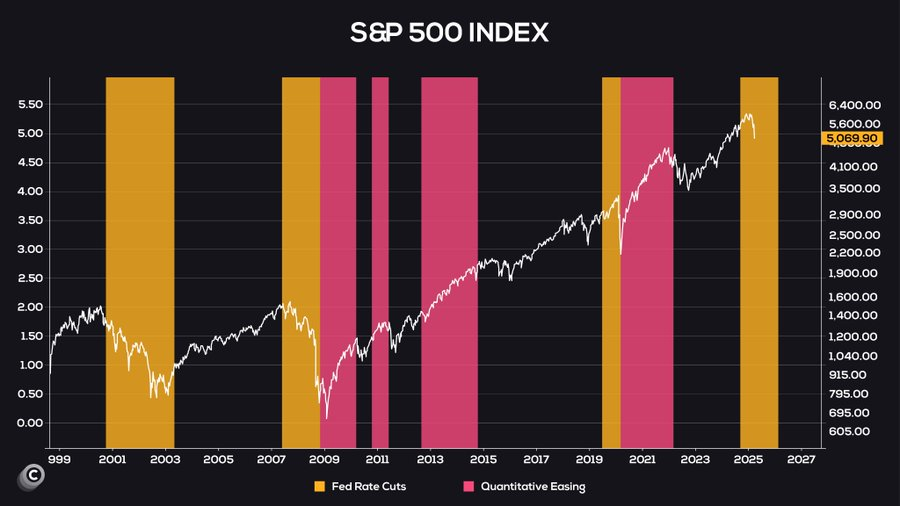
As yields from traditional assets fall, capital often rotates into speculative opportunities. This macro trend could continue supporting Bitcoin’s price gains.
Meanwhile, open interest (OI) in Bitcoin derivatives markets is rising. Perpetual contracts now account for $21 billion out of the $22.9 billion in total open interest. An increase of 1.38% in OI in the past 24 hours shows renewed trader activity. Open interest in perpetuals alone rose by 1.40%, indicating short-term market confidence.
Technical Analysis: Bitcoin’s Falling Wedge Pattern and Price Targets
Bitcoin’s recent price structure shows a falling wedge—a bullish pattern signaling possible reversal. The wedge is marked by lower highs and lower lows converging toward an apex, suggesting weakening bearish pressure.
The upper boundary of the wedge sits near $80,800. A breakout above this could trigger a push toward $90,000.
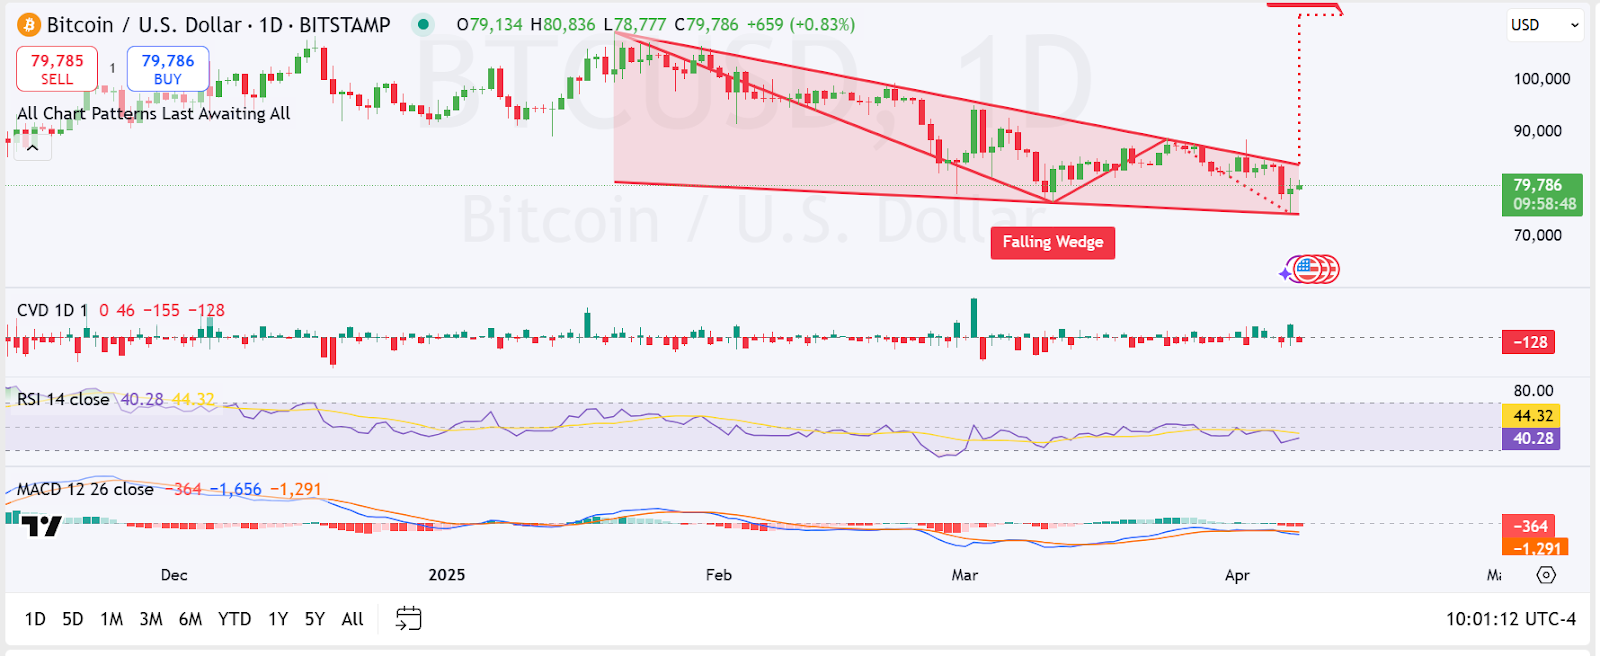
Currently, the Relative Strength Index (RSI) is at 40.28, indicating neutral momentum. If it moves above 50, the case for further gains strengthens.
The Moving Average Convergence Divergence (MACD) is still negative, but histogram bars are contracting. A bullish crossover of the MACD line above the signal line would confirm the reversal.
Cumulative Volume Delta (CVD) shows a net value of -128, meaning selling still slightly outweighs buying. A reversal in this metric could reinforce the bullish thesis.
Analyst Targets $300,000 as Bull Market Structure Holds
Market analyst GertvanLagen noted that Bitcoin recently bounced off the neckline of a four-year inverse Head & Shoulders pattern. The neckline, around $74,800, continues to act as key support.
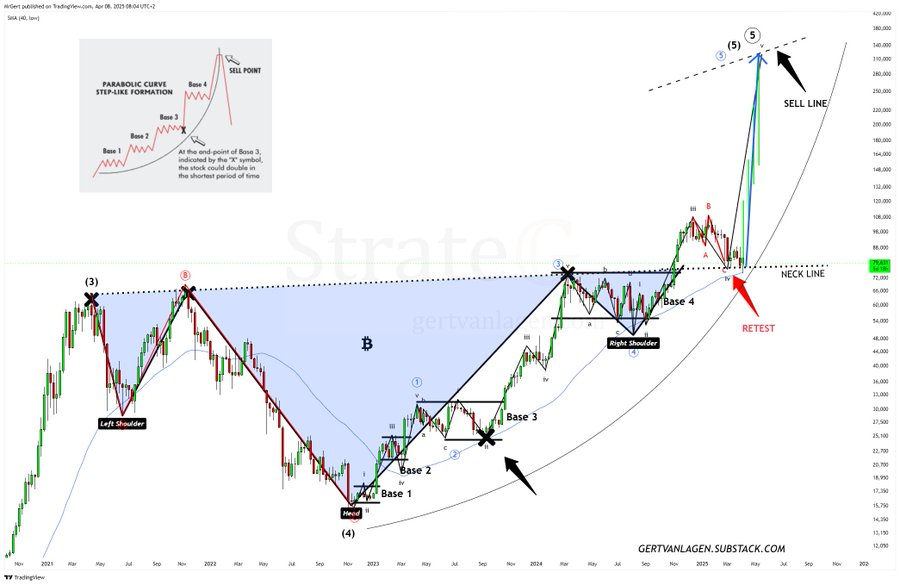
If this bullish setup holds, Bitcoin could target $300,000 over the long term. However, short-term resistance at $88,000 and $90,000 must be cleared first. A weekly close below $74,800 would invalidate the pattern.
Disclaimer
This article is for informational purposes only and provides no financial, investment, or other advice. The author or any people mentioned in this article are not responsible for any financial loss that may occur from investing in or trading. Please do your research before making any financial decisions.