
 Sword Inu
 streamoors
 Altai the Tiger
 no crying in the casino
 IGNITION
 Pudgy Penguins
 Quantus
Key Insights:
- XRP broke below its Head and Shoulders neckline in April 2025, triggering a sharp price decline.
- XRP is retesting the $2.00 neckline level, which has flipped from support to resistance post-breakdown.
- RSI bullish divergence on the Total 2 chart signals potential altcoin market reversal.
XRP price has recently moved below a critical support zone, following the completion of a bearish chart formation. Technical analysts are tracking this development as a potential continuation of XRP downward trend.
At the same time, market indicators are suggesting a different trajectory for altcoins. A commonly used momentum indicator is showing signs that selling pressure may be weakening across the altcoin market. These contrasting signals are drawing attention from traders monitoring both individual assets and sector-wide trend.
While XRP price pattern suggests a possible extension of its decline, a divergence on the total altcoin market chart may indicate an early-stage recovery. The ongoing price action in both areas continues to influence short-term market expectations.
Formation on XRP Price Raises Concerns
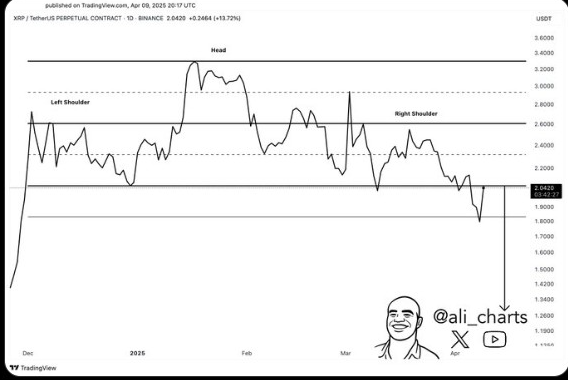
XRP price movement reflects a textbook Head and Shoulders formation, a technical pattern widely associated with trend reversals. The left shoulder was observed around late December 2024, followed by a higher peak forming the head in January 2025. The right shoulder developed between February and March 2025.
A neckline drawn across the support levels connecting the shoulders has been breached in early April, triggering a swift price drop.
This support break is a notable shift in XRP technical structure. XRP price rose back to $2.00 after the breach but this area has transformed into a key resistance point. Such a trend occurs when key technical levels transition roles after a breakdown, indicating that buying interest has weakened.
$2.00 Level Acting as Resistance for The Ripplen Token
Notably, the $2.00 zone has become a key area for XRP short-term outlook. After falling below the neckline, XRP retraced and tested this price range. Analysts point to this retest as a possible validation of the bearish structure. If the retest fails and sellers maintain momentum, further downside could occur.
Based on the height of the head above the neckline, technical projections suggest a possible price target between $1.20 and $1.25. The outcome of this neckline retest may determine whether the bearish trend continues in the near term.
Altcoin Market Shows RSI Bullish Divergence
While XRP faces downward pressure, technical developments in the altcoin sector indicate a different trend. On the Total 2 chart, which tracks market capitalization of all cryptocurrencies excluding Bitcoin, a bullish RSI divergence has been detected.
For context, this occurs when price action continues to decline, but the RSI, a momentum indicator, begins forming higher lows. This divergence suggests that downward momentum may be weakening and the market is setting up for an altcoin rally.
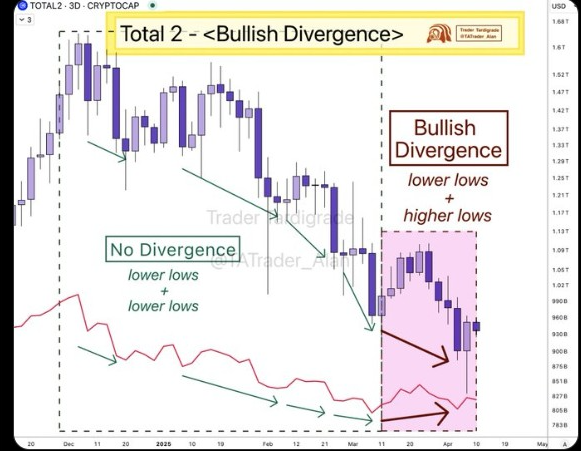
Earlier in the year, both price and RSI were making new lows, showing consistent selling activity. The current structure, however, differs from that pattern. As RSI trends upward while price declines, it introduces the potential for a reversal. Such divergences have historically been used by investors to identify turning points in market cycles.
These developments come as altcoins saw first inflows in 5 weeks, with crypto investment products recording $226 million in weekly inflows. Recent data from CoinShares indicates that Bitcoin led with $195 million, while Ethereum, Solana, XRP, and Sui contributed to a $33 million recovery for altcoins after a prolonged period of outflows.
Altseason Speculation Builds
The RSI divergence on the Total 2 chart is emerging as the market consolidates. Periods of divergence are often watched for early signs of trend shifts. Analysts note that previous bullish divergences in altcoins have preceded phases of strong performance relative to Bitcoin.
If current trends persist and are confirmed by upward price movement, traders may interpret this as the early stage of an altseason. Such periods have been characterized by altcoins gaining market share and outperforming Bitcoin. Monitoring RSI behavior alongside price activity remains central to gauging whether a broader recovery in altcoins is underway.
The Ripple token (XRP) has a market value of $1.94 during the time of research and it demonstrates a decrease of 4.86% in the last 24 hours. The price moved downward from the peak point above $2 because traders continuously sold throughout the day.
Disclaimer
In this article, the views and opinions stated by the author or any people named are for informational purposes only, and they don’t establish the investment, financial, or any other advice. Trading or investing in cryptocurrency assets comes with a risk of financial loss.




