
 Sword Inu
 no crying in the casino
 streamoors
 IGNITION
 Altai the Tiger
 Pearl
Pearl Quantus

Key Insights:
- AVAX forms a bullish double-bottom near key $23 resistance.
- Weekly trendline retest at $18.50 shows strong historical support.
- Open interest surges 14.91%, indicating rising trader participation.
AVAX price is signaling a potential breakout as several technical patterns and market indicators align to support upward momentum. The displayed double-bottom structure on the short-term chart, along with a retest of long-term trendline support and increasing open interest, are signaling potential upward movement.
Double-Bottom Structure Targets Breakout Above $23
On the 12-hour chart of AVAX, technical analysts have identified a double bottom pattern to be forming, and the pattern is typically regarded as a bullish reversal pattern. The pattern has two rounded lows around the $16–$17 zone, which serves as a level of strong buyer interest. This formation has its neckline currently around the $22.50–$23.00.
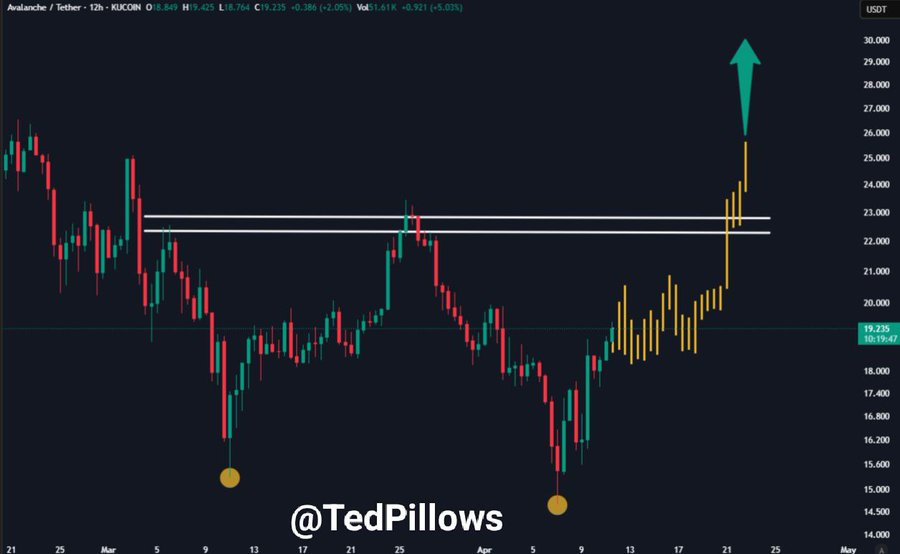
Market analyst TedPillows noted, “A 12-hour close above $23 would validate the pattern breakout,” potentially triggering a price surge to the $27–$30 range. AVAX traded near $19.30 before gaining upward momentum.
Long-Term Trendline Retest Holds Above $18.50
A broader view of the weekly timeframe reveals that AVAX is also testing a major ascending trendline that has held since early 2021. This trendline has now been tested three times, each followed by a bounce. The current test near $18.50 suggests that long-term support remains intact.
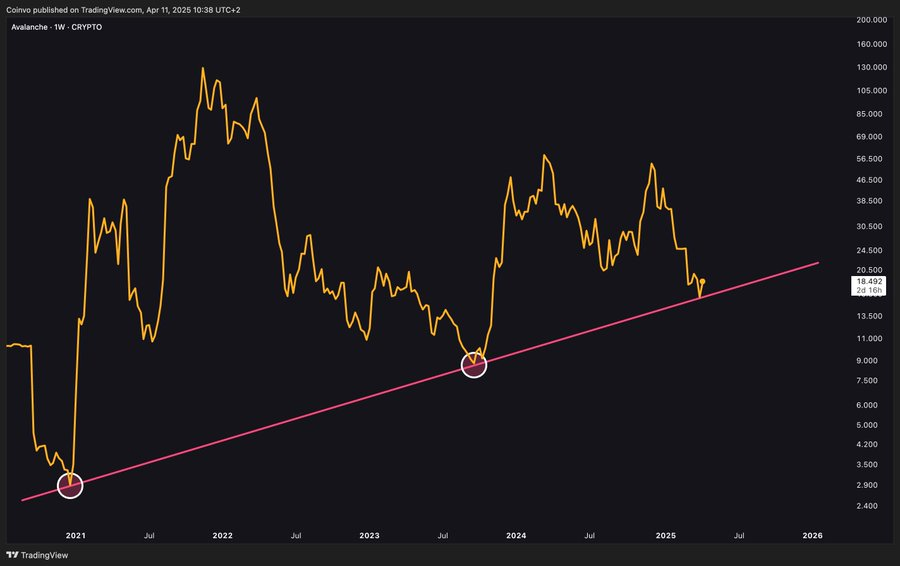
If the price holds above the $18.00–$18.50 level, the trendline could serve as a launchpad for another upward move. History reveals that AVAX protects this trendline by attracting renewed demand and rising trading volumes.
Bullish Momentum Confirmed in Daily Chart Indicators
The AVAX trading chart shows a double-bottom formation which confirms the current bullish trend. Price has just taken out the neckline of the double top pattern at $18.90–$19.00, now acting as support. Now, the next major resistance is around $23.00, after which there is a breakout towards $27 -$30.
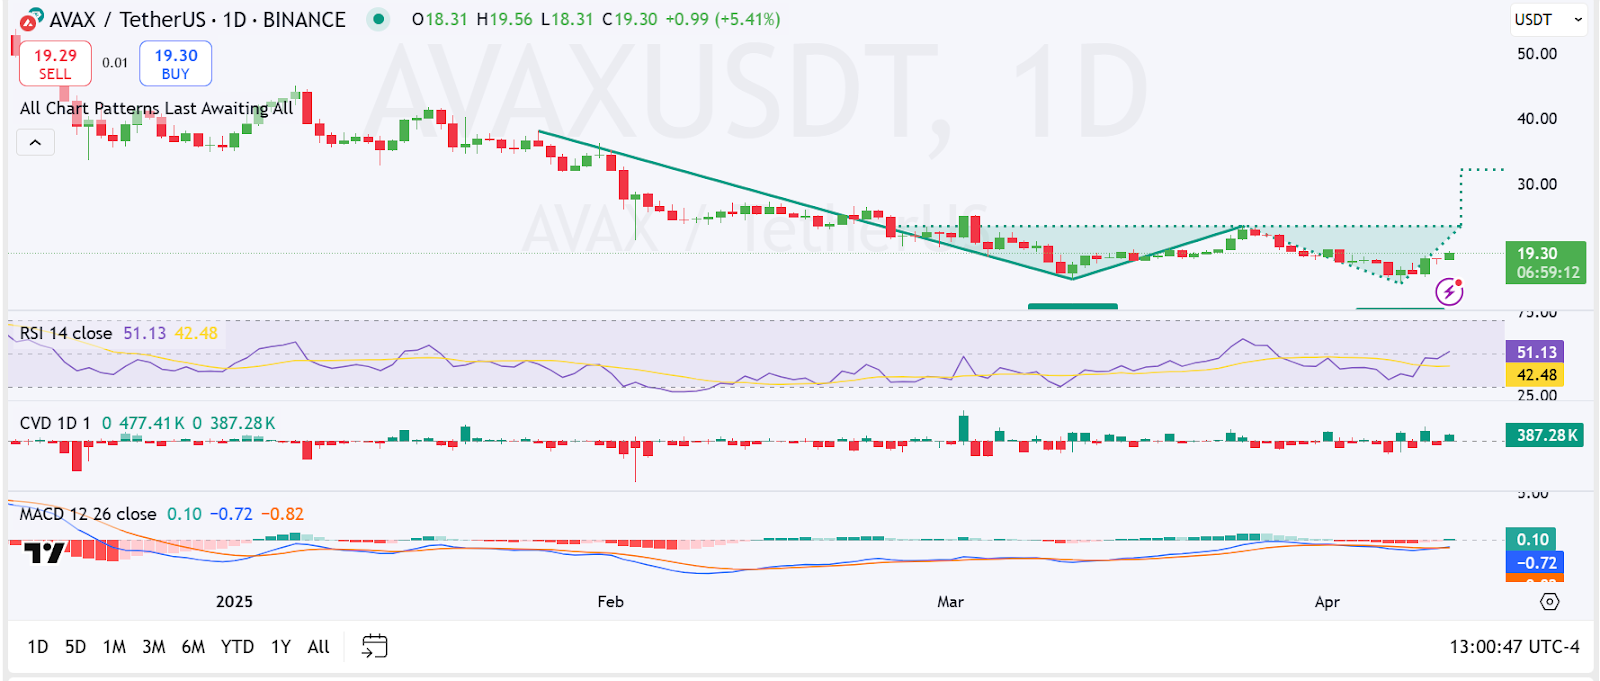
Technical indicators also support the ongoing momentum. According to the Relative Strength Index the market value stands at 51.13 indicating potential continued growth before becoming overbought. The Cumulative Volume Delta (CVD) presents a positive value of 387.28K which demonstrates that buying interests dominate the volume flow. Meanwhile, a bullish crossover has occurred as the MACD line has moved above the signal line.
Furthermore, AVAX open interest (OI) is at $215.7 million with all on perpetual contracts, with a 14.91% increase in the last 24 hours. This increased market reflects speculative engagement and more activity in the market.
Short-Term Forecast For AVAX Price
According to current forecasts, AVAX is expected to rise by 9.25% to reach $20.94 by May 10, 2025. Despite this projected growth, the broader crypto market reflects cautious sentiment. The Fear & Greed Index currently reads 25, indicating extreme fear even though AVAX’s sentiment remains technically neutral. In the last month, AVAX has had 15 green days and has experienced 7.92% volatility.
Backing up the bullish argument further is that Nasdaq has filed a Form 19b-4 for VanEak to list its spot Avalanche (AVAX) ETF. This filing represents an important step in gaining approval for the AVAX ETF and increasing institutional adoption of AVAX. This new ETF aims at tracking AVAX price without employing active management, which may attract traditional investors seeking exposure to crypto via regulated financial products.
Disclaimer
In this article, the views and opinions stated by the author or any people named are for informational purposes only, and they don’t establish the investment, financial, or any other advice. Trading or investing in cryptocurrency assets comes with a risk of financial loss.




