
 Zylo Ecosystem
 astronaut
 Pearl
Pearl Walrus
 Starknet
 Pudgy Penguins
 Bitcoin

Key Insights:
- Solana price broke out of a falling wedge and climbed above the 50-day SMA, signaling a trend reversal.
- Analyst sees an inverse head-and-shoulders forming, potentially pushing SOL toward $200 and possibly $260.
- Heavy shorts at $135 make it a breakout zone, and clearing it could fuel a rally to $147 and beyond.
Solana (SOL) price has dropped 1.1% over the past 24 hours, currently trading at $131, on a 10.9% decline in trading volume, now at $4.2 billion, according to CoinGecko. However, technical analysis points to a potential breakout after months of bearish pressure. Can Solana’s bulls drive the price 97% higher to reclaim its all-time high of $260?
Solana Price to Hit $200 on the Way to $260
Crypto analyst Kingpin Crypto shared a promising setup for SOL in which the asset attempts to solidify an inverse head-and-shoulder pattern, a classic bullish reversal signal.
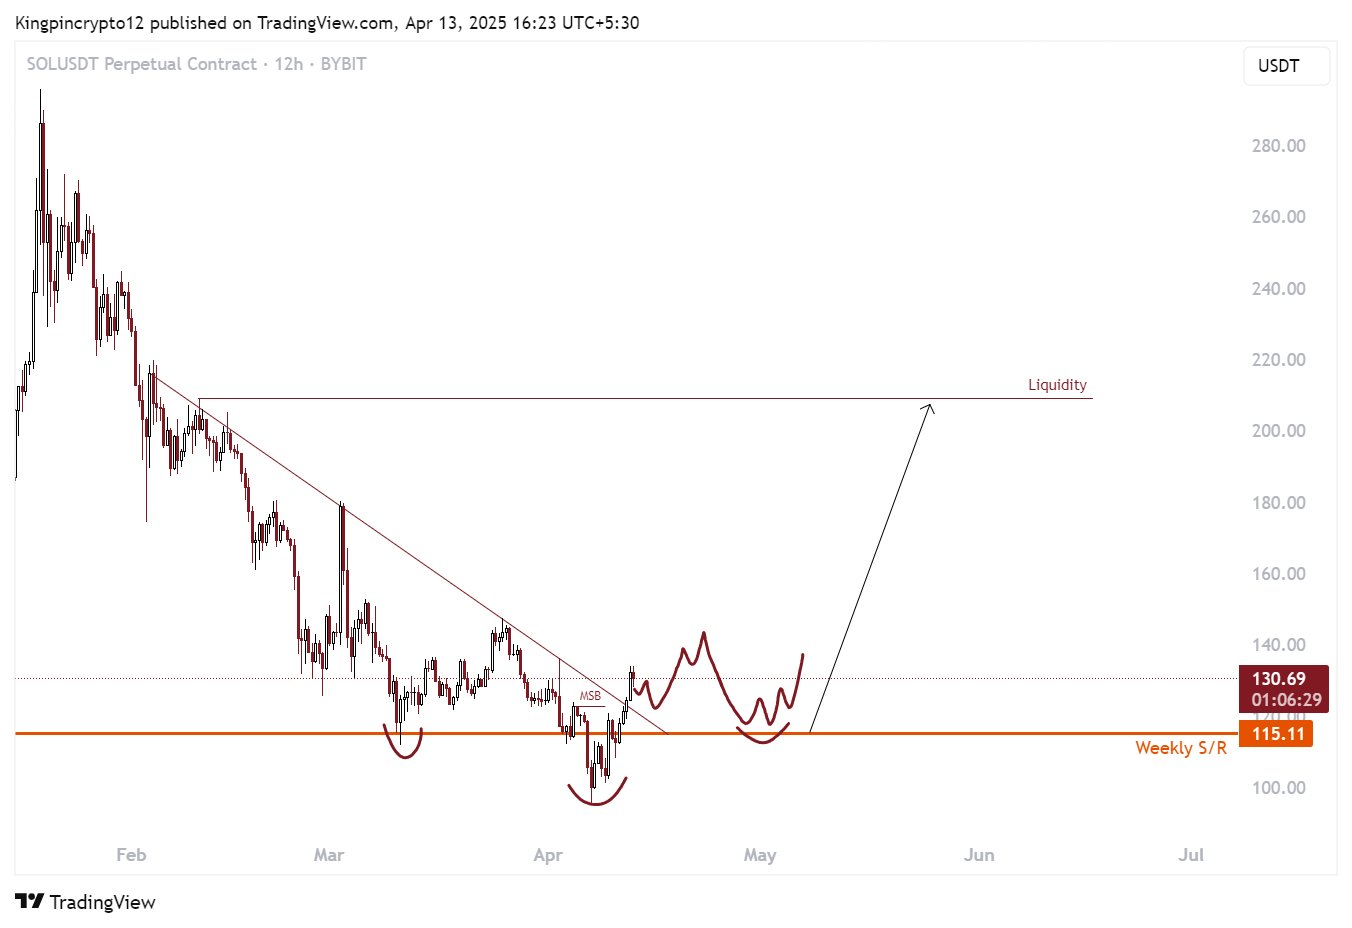
He notes that this pattern signals a trend reversal for SOL, coming shortly after breaking a daily bearish market structure.
Kingpin Crypto added that SOL must hold above a key weekly support/resistance (S/R) level at $115.11 to confirm the pattern. If confirmed, the next major target is $200, with $260 in sight as a long-term milestone.
Solana Price Testing Key Resistance at $130
A classic bullish breakout indicator, the falling wedge pattern has broken to the upside on the SOL price chart. A trend reversal has been confirmed by SOL’s climb above the 50-day simple moving average (SMA).
Technical indicators also support a bullish scenario. The relative strength index (RSI) is at 54.42 but rising, suggesting more upside potential for the price of Solana. The Moving Average Convergence Divergence (MACD) indicator flashed a bullish crossover on April 10, a sign that momentum was shifting upwards.
Up ahead, the SOL price eyes an initial 11% increase to the $147-$153 zone as its first milestone. This level aligns with a liquidity zone marked on the chart, where SOL could face some resistance before attempting a larger breakout. If SOL sustains above $130 and breaks $155, it could head toward the $190-$200 range in the next leg up.
The path to $260, however, would require a 97% surge from current levels, a tall order but not impossible given Solana’s history of explosive rallies.
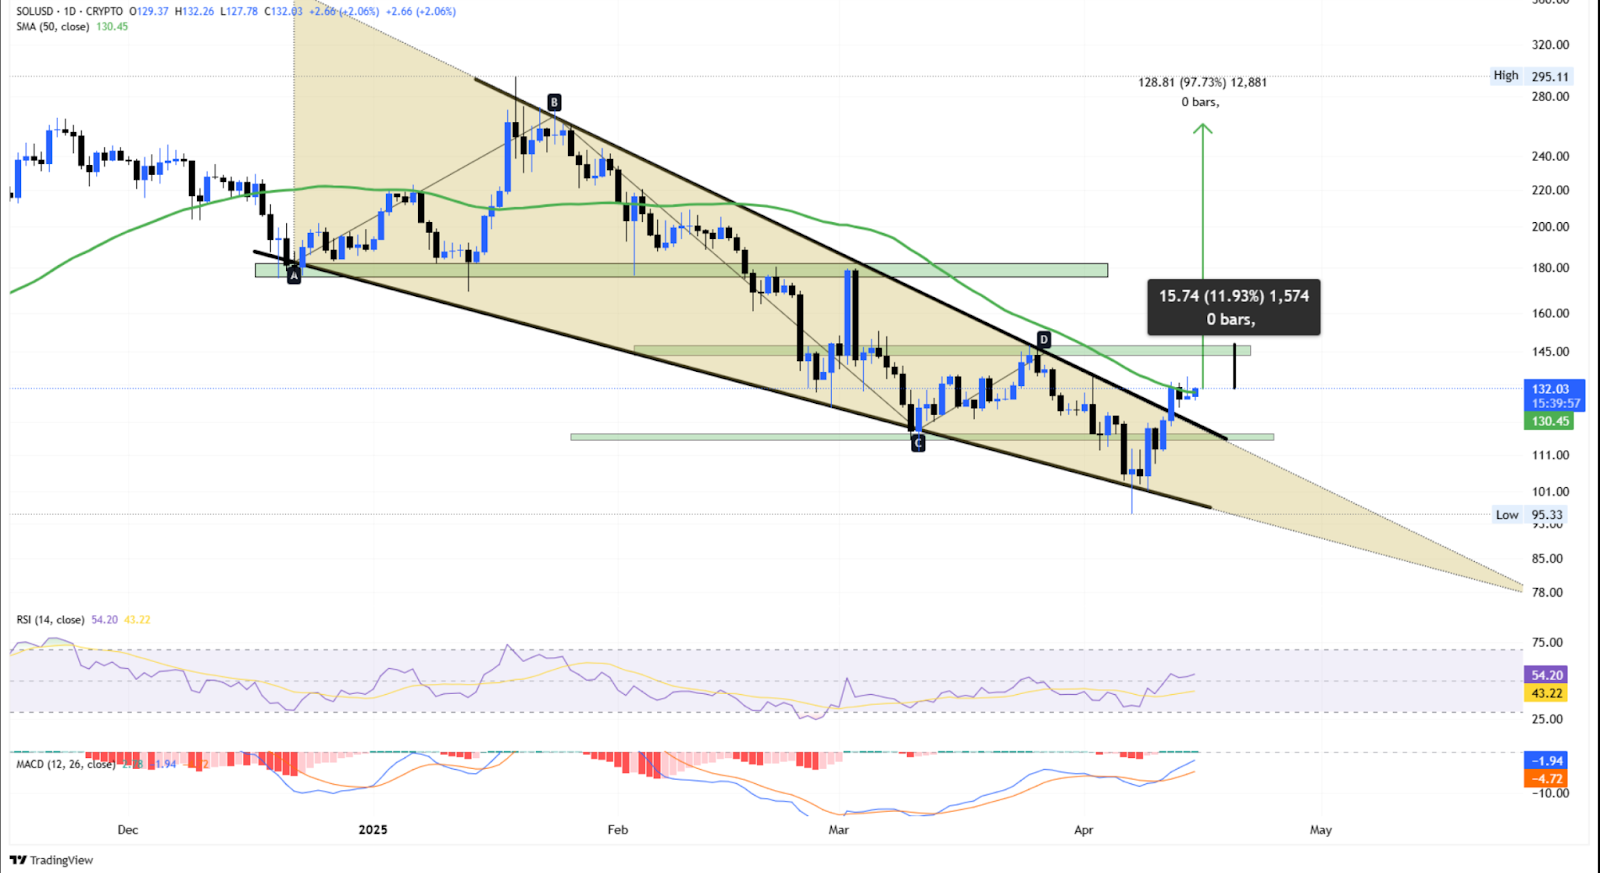
If the bears drive SOL under that $115 support, it’s going to signal market weakness, probably tanking the asset to $95 and wrecking the current bull thesis. However, Kingpin Crypto has warned that traders who sold below $100 in the dip might be crying when this bullish setup pops off.
SOL Price Is Ready to Flex
Onchain data indicates Solana is entering a bull mode. Data from the Coinglass liquidation map shows $762 million in cumulative long liquidation leverage against $297 million in corresponding shorts this past week. This shows that bulls are dominating the market as traders anticipate further upside potential for Solana price.
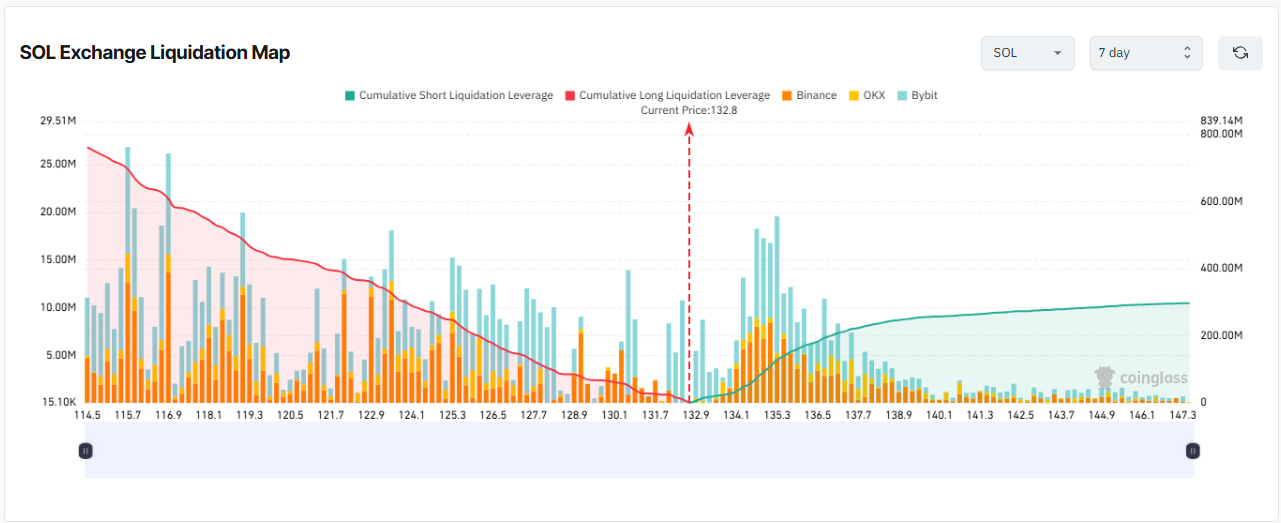
A deeper analysis of the liquidation map reveals an accumulation of short orders at around $135.3, making this level a major obstacle for SOL price. If Solana breaks above this price, it will trigger a quick rally to $147.
Meanwhile, Coinalyze data reveals a curious trend: While the SOL price has been rising, the aggregated open interest (OI), which represents the total number of outstanding futures contracts, has been dropping.
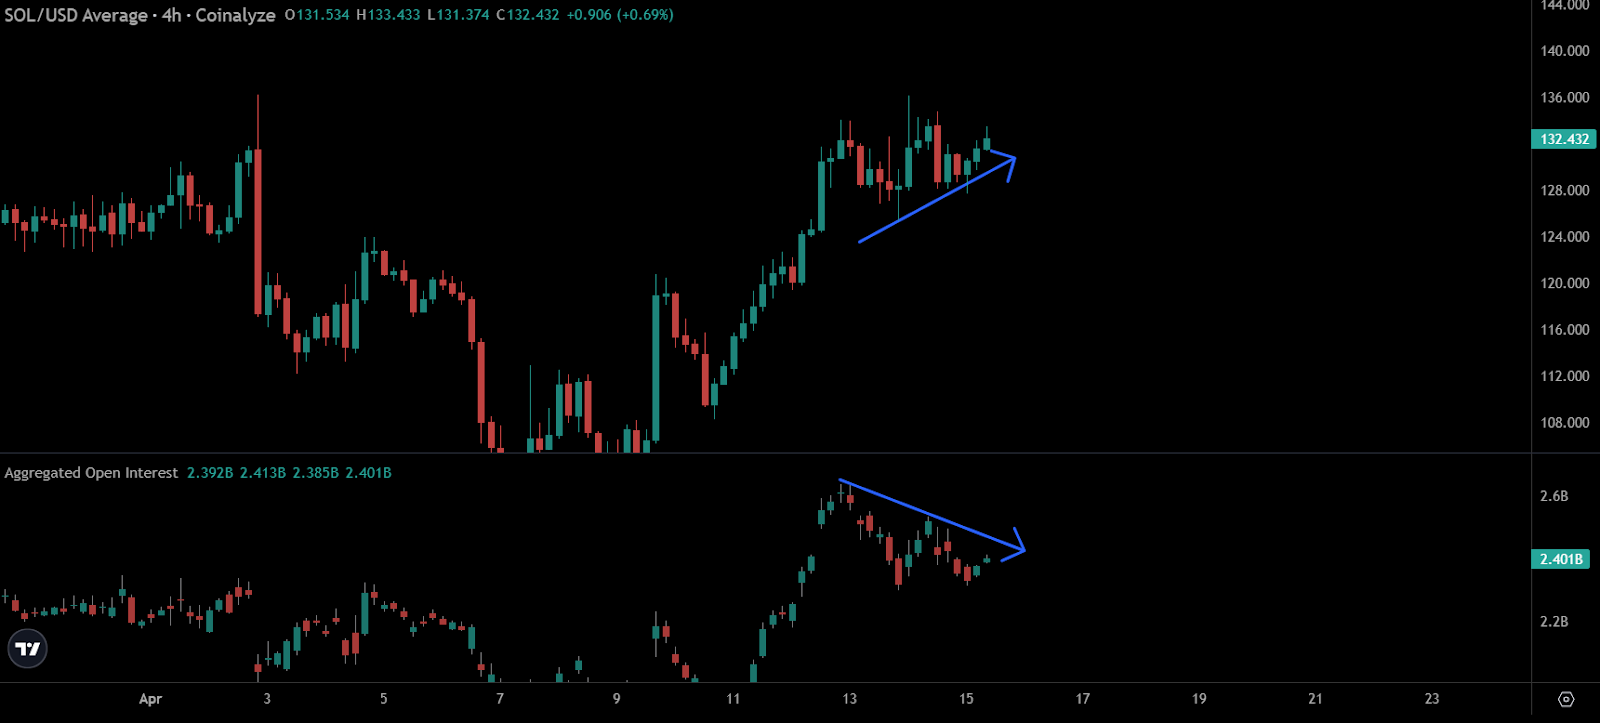
As these traders close shorts and potentially open long positions, additional buy pressure could emerge.
Currently, traders are watching the $135 and $147 levels closely. A successful breakout through these could signal the start of a broader move, with $200+ targets back on the table.
Disclaimer
This article is for informational purposes only. Crypto investment involves inherent risks due to the volatility in price. Readers should conduct their research before making any investment decision. Also, you can consult a crypto expert before investing in cryptocurrencies.




