
 Zylo Ecosystem
 astronaut
 Pearl
Pearl Walrus
 Starknet
 Pudgy Penguins
 Bitcoin

Key Insights:
- AVAX price forms a double bottom pattern with a target price of $30.
- Price is testing key support at $17, with a potential higher low forming.
- Breaking $22 resistance could trigger a rally toward $23–$25.
Avalanche (AVAX) price is showing strong bullish potential, as it forms a double bottom pattern on the daily chart. This technical formation often signals a reversal of the current downtrend and suggests that the asset may be preparing for a significant rally. With a clear price target of $30, the bullish momentum for AVAX could continue if it breaks key resistance levels.
Double Bottom Formation and Price Action
On the daily chart, AVAX clearly shows that there is a double bottom pattern, and the first low is around $18 and the second is at the same level. This structure is a strong resistance reversal signal, especially after a trend down has been prolonged and the market finds support.
However, after forming these two consecutive lows the price broke above this neckline or at $19.60 as this marks the preliminary sign that a similar trend reversal is taking place.
As the price action continues to show strength, traders and analysts are focusing on the next key resistance level at $22.
If AVAX manages to break through this level, it could trigger further upward movement. The price target for this double bottom pattern is projected to be around $30, which would mark a significant gain from the current levels.
AVAX Price Technical Indicators Support Bullish Outlook
Several technical indicators are in agreement that AVAX remains in a bullish outlook. The Relative Strength Index (RSI) is 30.26 and indicates that the price is now oversold and a rebound is likely to occur. Additional confirmation of bullish momentum would be if the RSI crosses above 50.
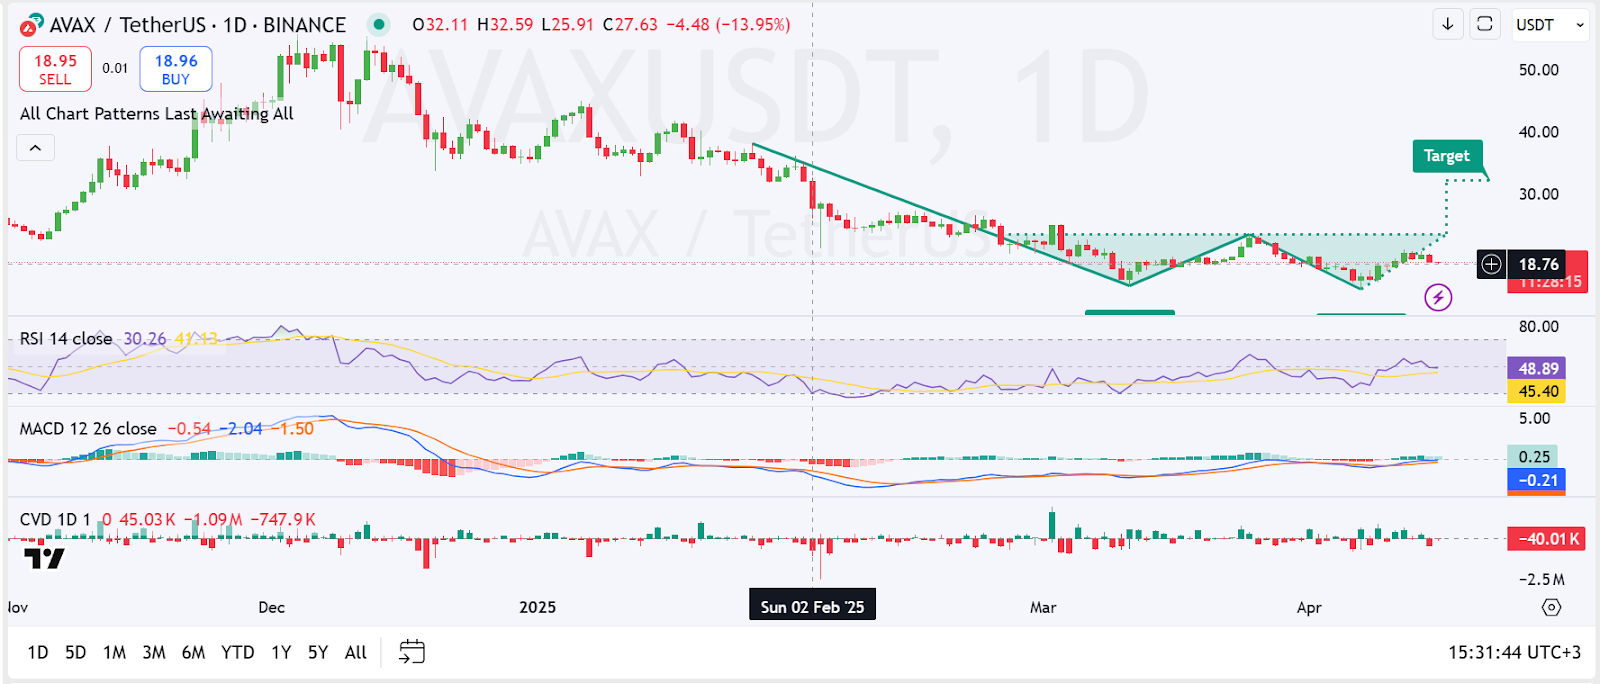
Meanwhile, the Moving Average Convergence Divergence (MACD) is also showing an upside bias as the histogram has recently changed to a positive figure and the MACD line is crossing above the signal line. This suggests that the bullish momentum is gaining strength, and the market may be gearing up for a breakout.
Strong Support at $17 and Bullish Momentum
An important bull signal for AVAX is the $17 support level. In the past few weeks, the price has constantly been trying to break the support zone, and every time buyers have rescued to prevent the price from falling further. As a result, the series of higher lows is indicative of bulls getting stronger.
Nevertheless, AVAX’s current price action displays it to be building higher lows over the $17 support, all of which add some weight to the bullish case. Breaking the $22 resistance will also signify an ongoing trend reversal and a potential rally to the $30 level as the price moves upwards.
Liquidation Data Shows Market Volatility
The chart showing long as well as short liquidations on AVAX shows the market is volatile. Short liquidations during price spikes have soared, certainly a sign that AVAX is now acting past resistance levels and forcing those who are short the price to exit. That suggests that current market sentiment is bearish and will be followed by a bullish trend.
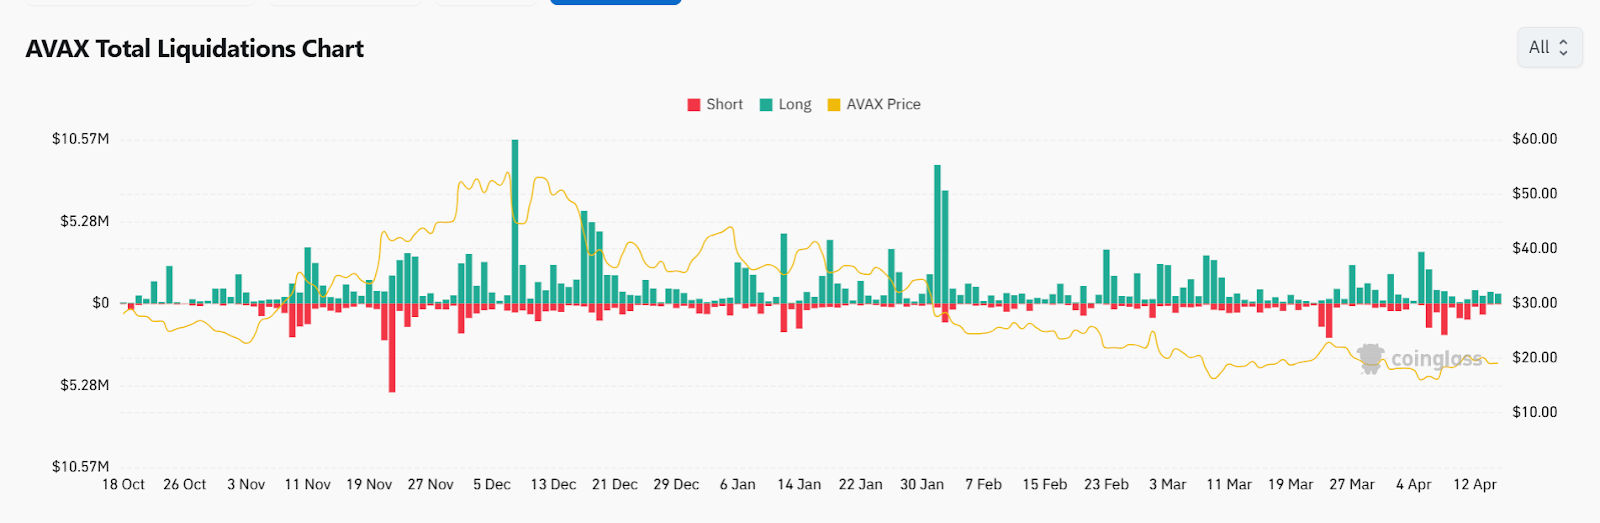
The chart reveals periods of high volatility on the liquidation chart, but the price has been stabilizing around $30. If the price can be contained above this level and proceed to further rally, this will result in additional liquidations of short positions, thus providing increased upward pressure on the price. Breaking the key resistance levels of $22 to $30, AVAX can target higher prices like $35 and $40.
Analyst Insights and Predictions
Market analyst AltCryptoGems noted that AVAX is squeezing at a macro support level. The price is forming an inverse head-and-shoulders pattern—a classic bullish structure.
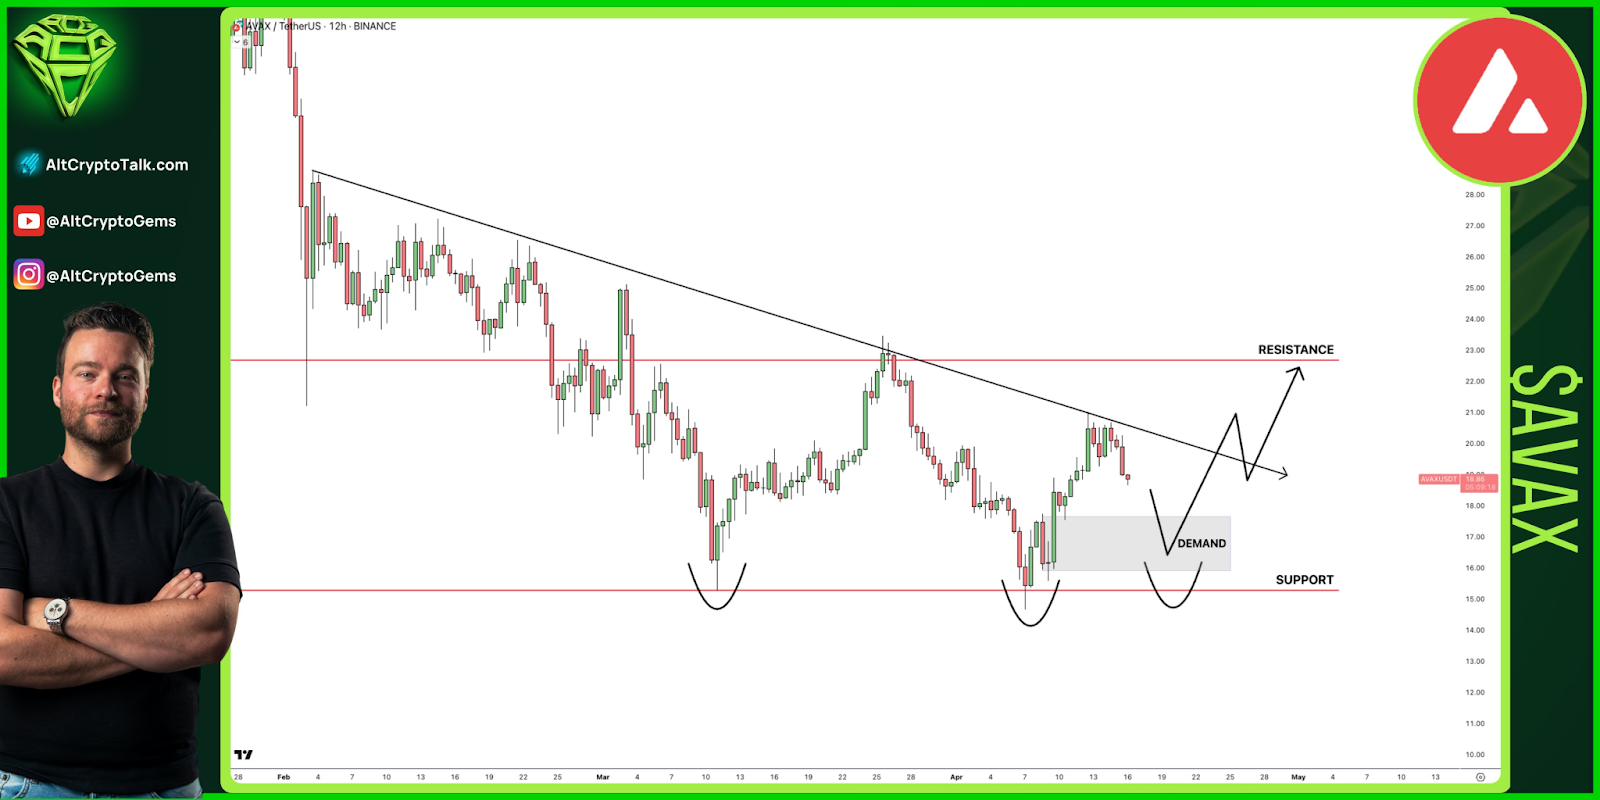
A successful breakout above $22 could push AVAX toward $23–$25 in the short term. Continued bullish structure and strong volume support could further validate the target of $30 and beyond.
Disclaimer
This article is for informational purposes only and provides no financial, investment, or other advice. The author or any people mentioned in this article are not responsible for any financial loss. That may occur from investing in or trading. Please do your research before making any financial decisions.



