
 Pearl
Pearl Bitway
 Pudgy Penguins
 Quantus
 Walrus
 Quant
Quant Artificial Superintelligence Alliance

Key Insights:
- Solana trades between $129 and $144, with heavy buying volume clustered around both levels
- Daily network revenue tops $4 million, the highest since February 21, reflecting rising activity
- Solana leads blockchain app revenue, holding a 70.4% share as of April 16, ahead of Ethereum and others
Solana is gaining momentum as it approaches the $144 resistance zone, with the price holding around $138. Network revenue just crossed $4 million daily, its highest in nearly two months, while Solana continues to dominate blockchain app revenue across major platforms.
$129–$144 Emerges as Solana Price Key Range
According to Glassnode, Solana (SOL) is trading within a key price range, with major support at $129 and resistance near $144. At $129, they acquired around 33.7 million SOL, 5.75% of the total supply. At the same time, 28.8 million SOL, or 4.92% of supply, was purchased near $144.
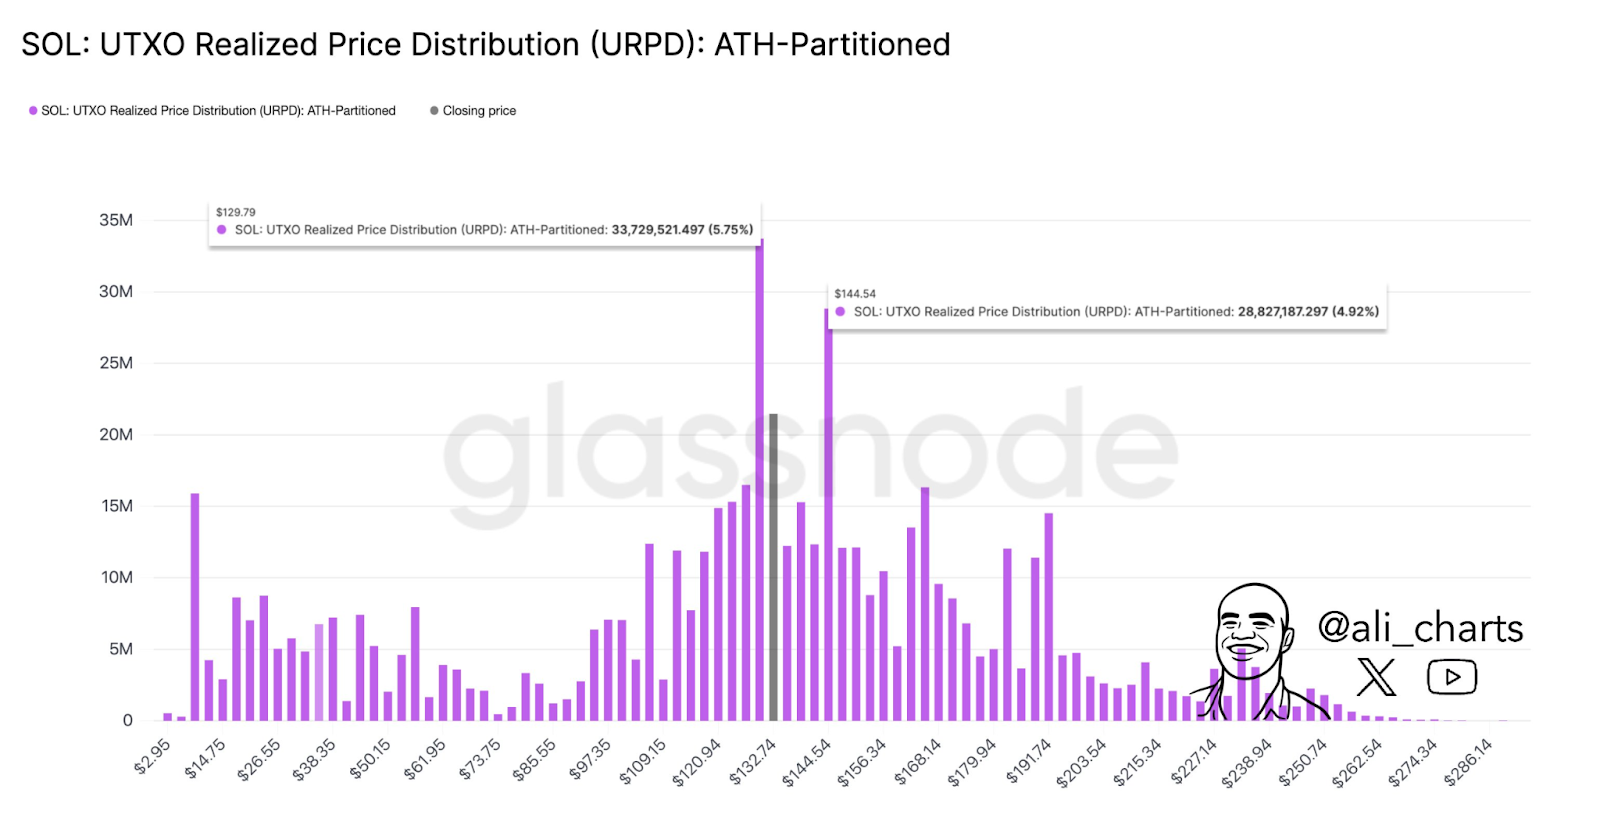
The clustering of realized price levels indicates these areas are likely strong support and resistance zones. Currently, the price is moving around $138 between these two levels. A breakout above $144, however, would have traders watching for further upside. If it fails to hold above $129, it may instead set off renewed selling pressure.
These levels are a representation of long-term holders and large position cost basis. These zones often determine price action by being a magnet during periods of consolidation and decision-making in the market.
Solana Network Revenue Hits Highest Level Since February
Network activity on Solana is gaining strength again. According to data from Blockworks Research, daily revenue reached over $4 million on April 16, the highest level since February 21. This figure includes transaction fees as well as out-of-protocol tips.
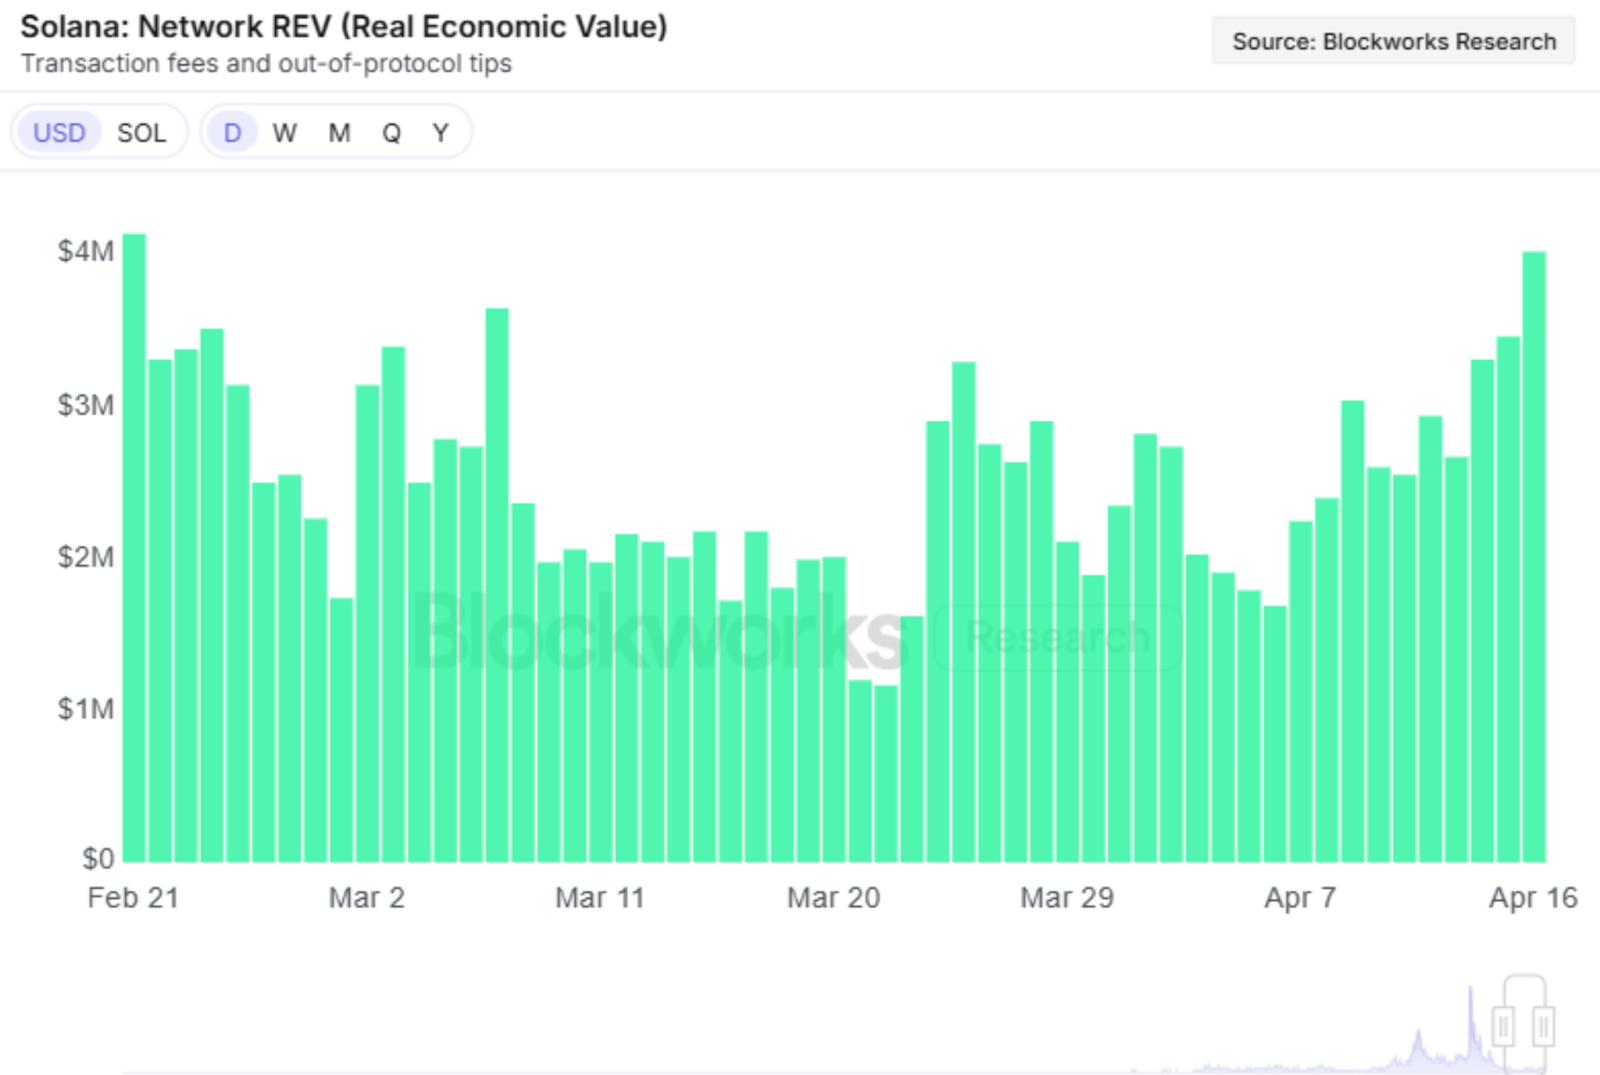
Daily revenue has been on the rise steadily since late March. This indicates that more users are interacting with the network as they move from under $2 million to over $4 million. Long-term ecosystem growth and developer interest are often supported by increased on-chain activity.
The revenue growth is in line with a wider recovery in usage. This comes at a time when Solana’s price is testing resistance, which could give further confidence to market participants if activity stays strong.
Solana Leads Blockchain Revenue Rankings
At present, Solana is number one in blockchain revenue distribution. According to April 16 data from DeFiLlama, Solana made up 70.4% of all blockchain application revenue. Hyperliquid was at 13.7%, followed by Ethereum at 7.35%.
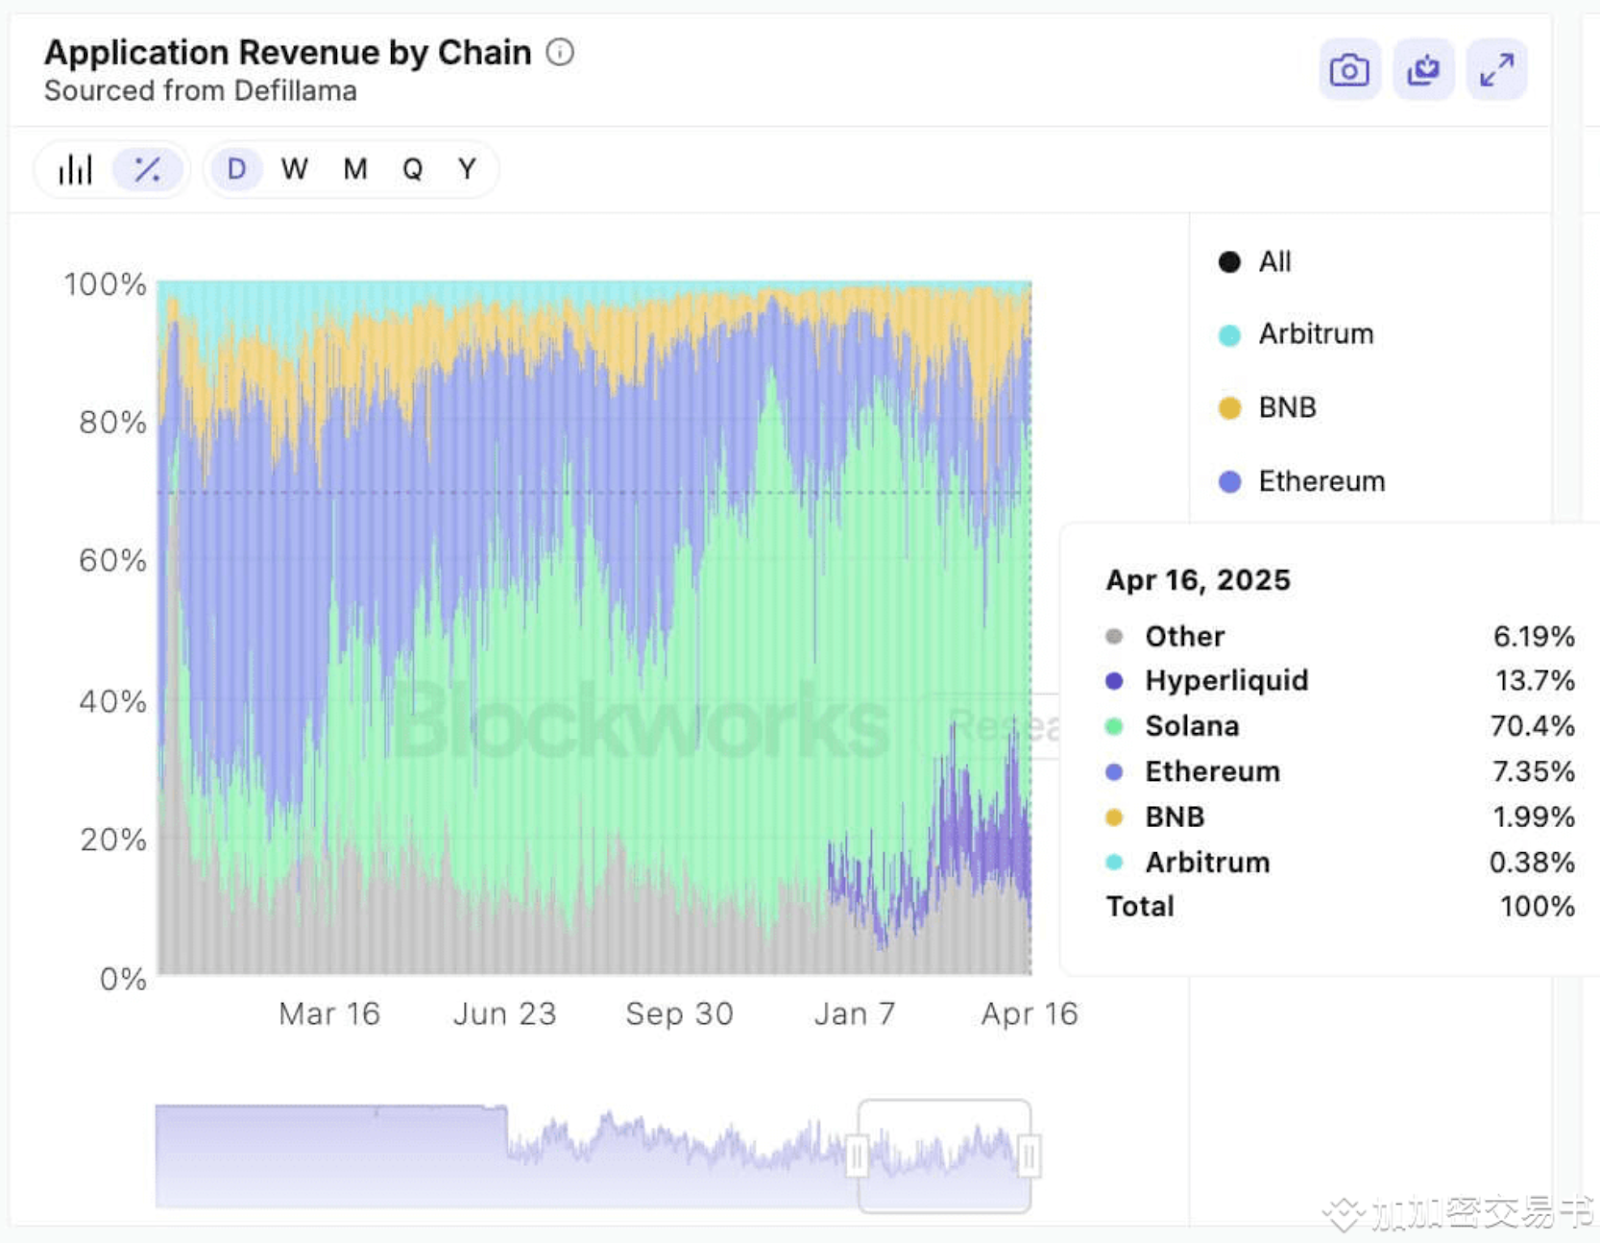
According to Syndica’s decentralized application (dApp) revenue breakdown, Solana held a market share of 46% in March 2025, followed by Ethereum with 17%, Hyperliquid with 13%, and BSC also with 13%. The platform has traction in supporting high-volume applications, and these consistent rankings show it.
Solana’s position implies that developers and users are becoming more confident. The network’s ability to keep up with lower fees and faster processing is reflected in its performance at the infrastructure and application-level activity.
Solana Price Technical Chart Shows Potential for Breakout
Moreover, on a 4-hour chart from TradingView, Solana’s short-term price action is bound between $124.70 and $148.05. At the time of writing, SOL is currently trading near $138.29, just below key resistance.
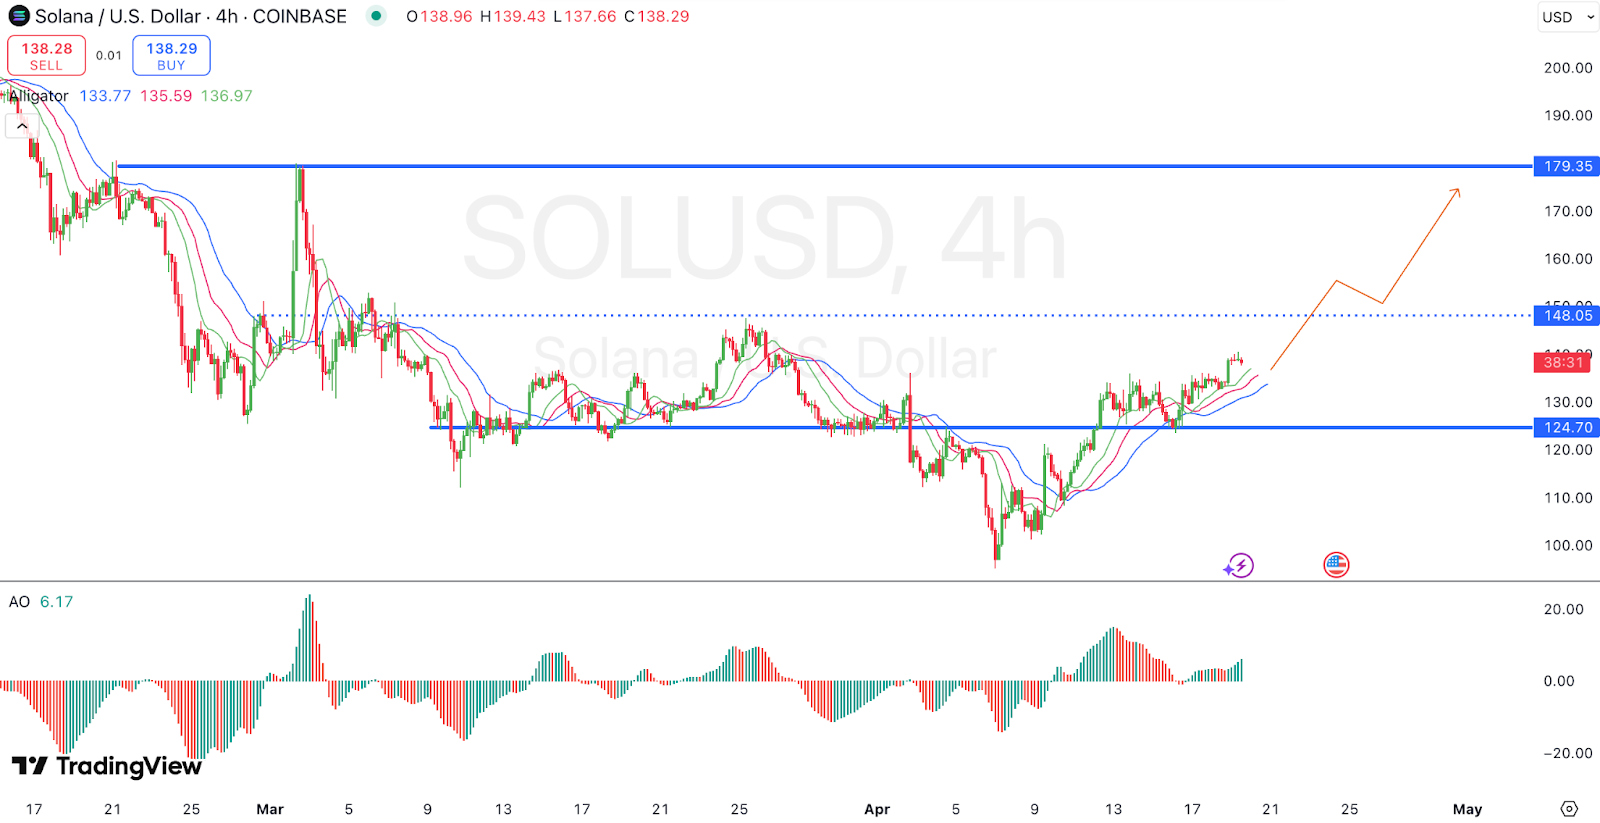
If the Solana price breaks above $148, the next target lies at $179.35. On the downside, failure to hold $124 could lead to a drop toward $100. The Alligator indicator is beginning to fan upward, and the Awesome Oscillator has turned green—suggesting strengthening momentum and growing buy interest.
Disclaimer
In this article, the views, and opinions stated by the author, or any people named are for informational purposes only, and they don’t establish the investment, financial, or any other advice. Trading or investing in cryptocurrency assets comes with a risk of financial loss.



