Zerebro
 Bitcoin
 Aerodrome Finance
 ZKsync
 Pearl
Pearl Pudgy Penguins
 Bitway

Key Insights:
- Sui price broke out of an ascending triangle with a 76% 3-day surge, signaling strong bullish momentum.
- If momentum holds, SUI could rally to $3.90–$5.3, a potential 70% move from current levels.
- Sentiment on X and interest from institutions like Grayscale are boosting sentiment; ecosystem growth is adding fuel.
The Sui price has jumped 2.3% in the last 24 hours to trade at $3.05 on a 12% rise in trading volume. SUI technical analysis shows the asset is on the road to secure more gains as Grayscale finally succumbs and launches a SUI trust. So, let’s break it down— Can Sui really pump 70% after smashing through a key pattern?
Grayscale Launches SUI Trust
The crypto community on X is hyped, and for good reason. Grayscale dropped a post on April 24, 2025, hinting at increased institutional interest in layer-1 projects like Sui, saying, “Scalability and speed are key, and Sui’s tech is catching eyes”. That’s a big deal—when institutions start paying attention, prices tend to move.
In addition, the SUI-ecosystem is leading social mentions for the second consecutive day, per data from LunarCrush. When social mentions surge, price tends to follow suit.
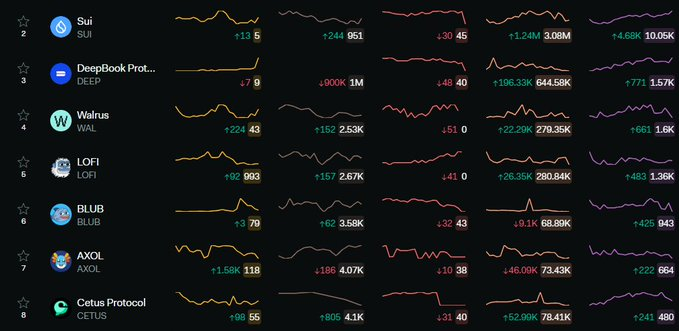
Crypto analyst Crypto Kabaka has predicted that the SUI price “could reach $14.45 in 2025”, returning an ROI of 380%.
He noted the asset recently climbed into the top 5 in DEX trading volume, signaling growing adoption, developments that make SUI a worthy contender for the top 5 crypto projects.
Bullish Breakout Targets 76% Gains for SUI Price
Looking at the 1-day SUI/USD chart reveals that the SUI price has been trending upward over the past three days. The candles show higher lows, meaning buyers have been stepping in hard, while the flat resistance exists around $3.17, coinciding with the 200-day simple moving avg. (SMA).
Sui just broke out of that double bottom, closing at $2.96 as of April 23, 2025. That’s a 47% surge on the 3-day timeframe—massive! The breakout happened with a clean move above the neckline (marked on the chart), and now analysts suspect SUI might be seeing a textbook pullback to retest that level.
However, if this bullish momentum holds, the SUI price could be looking at a continuation to the upside.
Indicators are looking pretty solid, too. The RSI (14) is at 55.56—not overbought yet, meaning there’s room to run. The moving average Convergence/divergence (MACD) indicator signals a slight bearish divergence, but since the histogram is tightening, it could signal a momentum shift soon. Volume bars at the bottom are mixed, but the breakout candle had decent buying pressure.
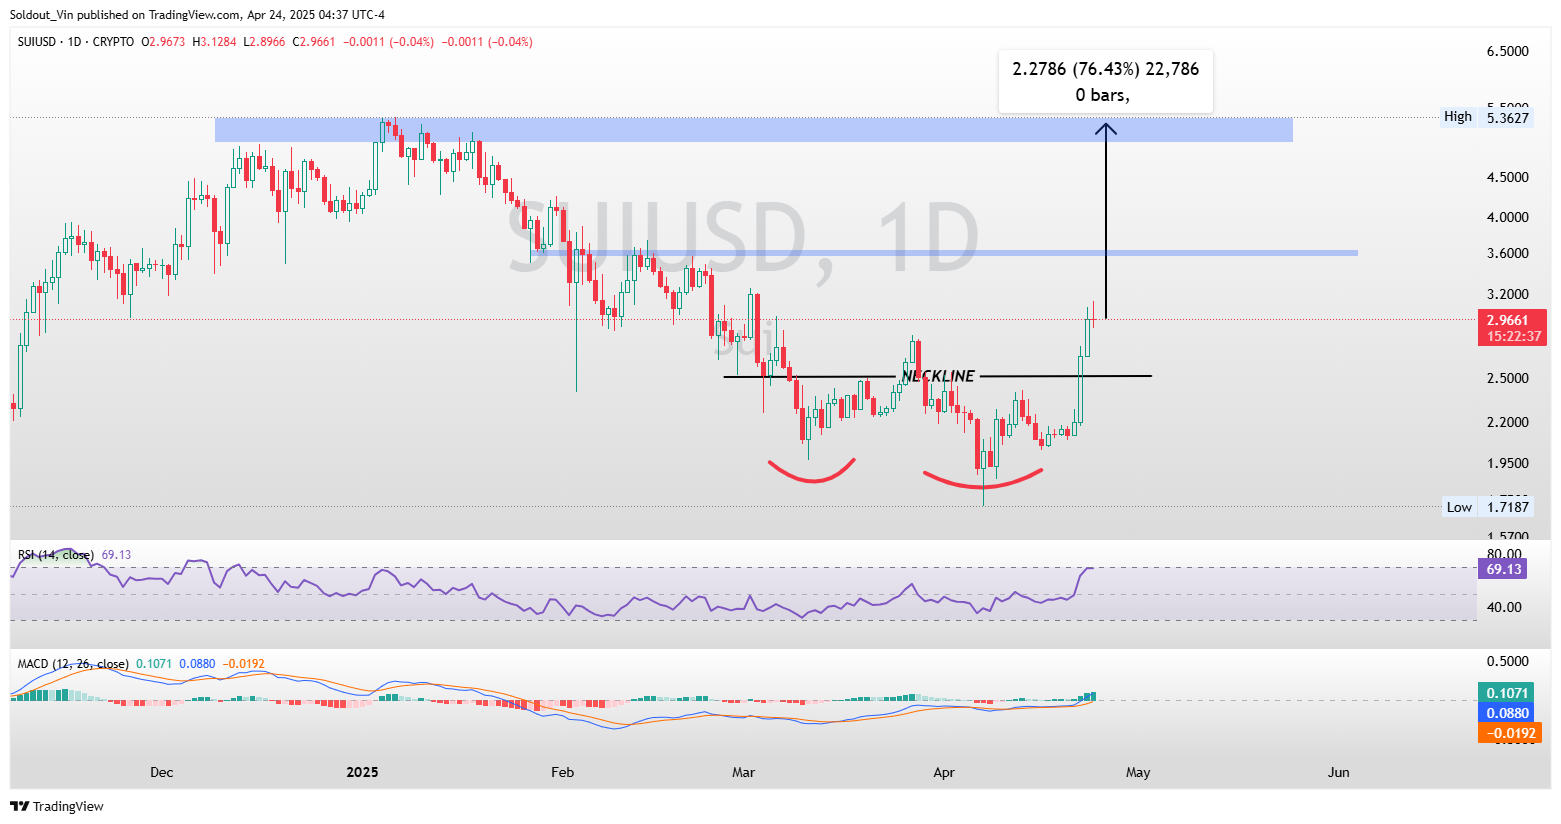
While $3.56 and the 200-SMA present a strong resistance, the price of Sui could overshoot that target and hit the next major resistance around $5.3, as seen on the chart’s right side with historical highs.
And it looks to be up to 76.43% from this point, which, given Sui’s previous spurts, is quite plausible. In late 2024, Sui was priced at $1 and subsequently reached $2.40 over a few short months, which is approximately a 140% spike.
However, before going all-in, traders must exercise caution. If that neckline retest fails and Sui drops below $2.52, it could result in a devastating fakeout. The next support sits around $2.00-$2.10, where the 50-day SMA and previous consolidation levels align. A break below that could send us back to $1.72 (the 200 SMA), which would be a bummer.
So, can Sui surge 70% after this breakout? The chart says yes, the X community says yes, and the fundamentals are lining up. Sui has a confirmed double bottom breakout, a target around $5.3, and a ton of hype from big players like Grayscale. If the neckline holds and momentum picks up, Sui could slap that 70% gain and hit $5 and beyond.
Disclaimer
In this article, the views, and opinions stated by the author, or any people named are for informational purposes only. And they don’t establish the investment, financial, or any other advice. Trading or investing in cryptocurrency assets comes with a risk of financial loss.