
 Puffer
 ZKsync
 Pearl
Pearl Bitcoin
 Ondo
Ondo Walrus
 Pudgy Penguins

Key Insights:
- TRX price recovers over 1% in a day after the news.
- Staked $TRX filing just got the SEC’s nod.
- TRX technical analysis showing a bullish wedge structure.
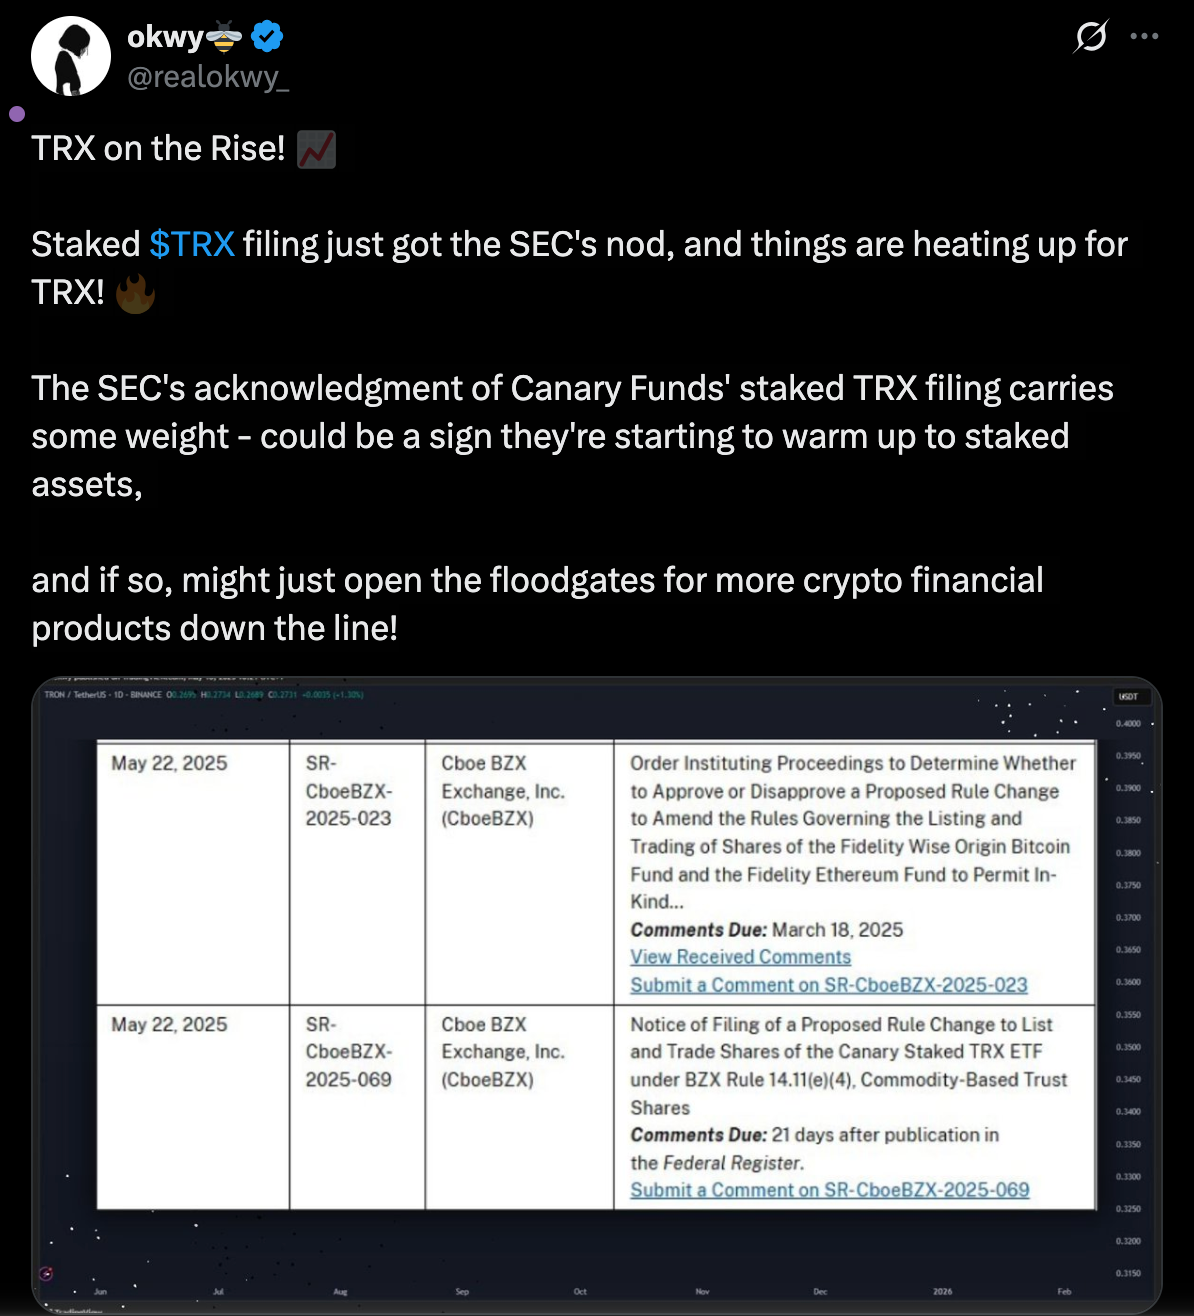
The Canary Staked TRX ETF, which is listed on the Cboe BZX Exchange, Inc. and traded under the ticker symbol CTRG, was approved for listing and trading on May 22, 2025, by U.S. Securities and Exchange Commission in a proposal.
The proposal is for a rule change by Cboe BZX Exchange, Inc. The filing of this notice, under the designation SR CboeBZX 2025 069, marks a significant regulatory moment in the willingness of the SEC to work with staking-based crypto financial products. The Commodity-Based Trust Shares, which comprise the application, are BZX Rule 14.11(e)(4) applications.
TRON (TRX) sees this filing as a meaningful step in the face of the more general regulatory reluctance of the U.S. towards staking-based ETFs. Now published on the Federal Register, this submission has officially started the process and will see public comments due within 21 days.
The acknowledgement alone is already having an observable effect on market sentiment and now there’s speculation around the growing legitimacy of staked assets and opportunities for inclusion in incumbent financial products.
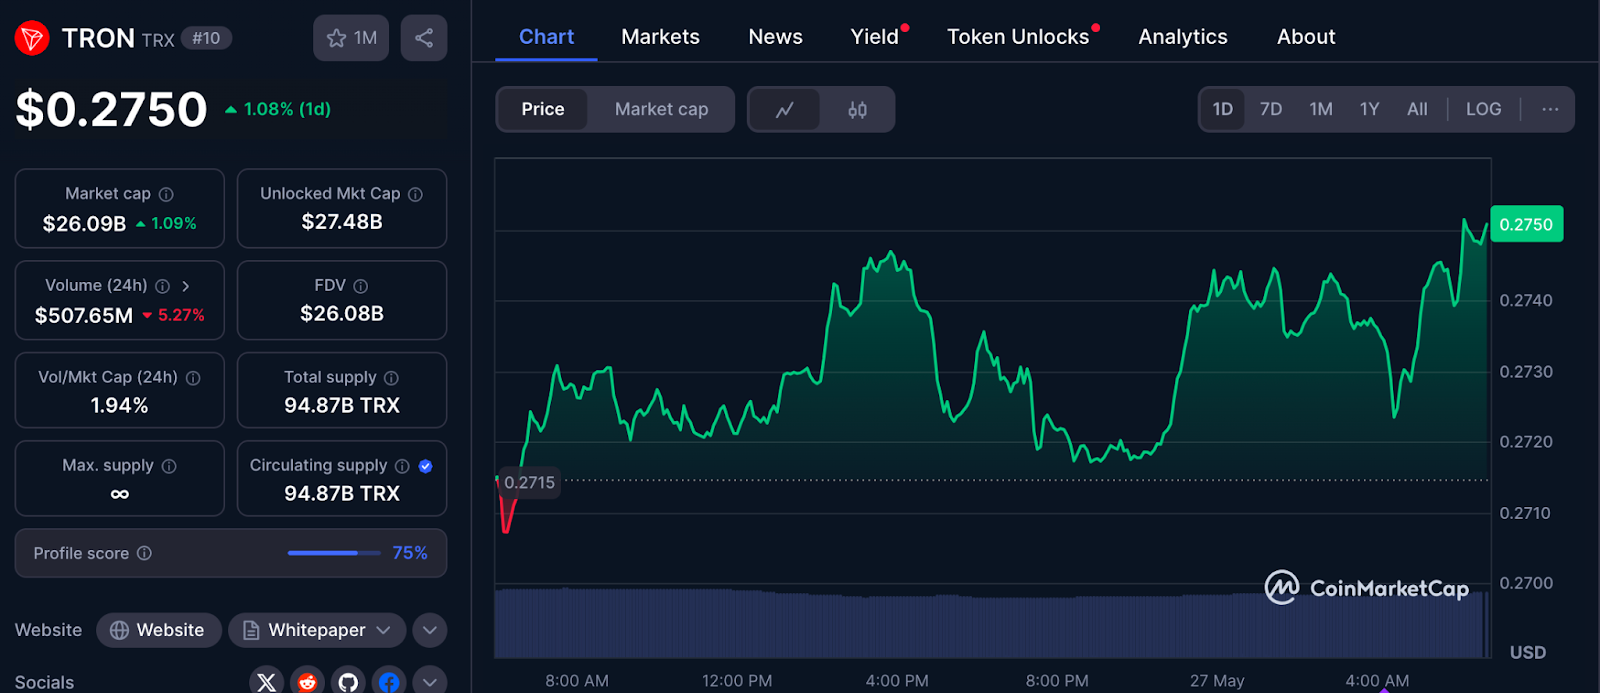
TRX Price Sees Modest Price Uptick After ETF Filing
After the filing was acknowledged, TRX soared 1.08% in 24 hours and was traded at $0.2750 on May 27, 2025. The pump comes after another recent pump stirred by a Solana partnership. But market response has been relatively measured and very positive.
Despite a 5.27% pullback in 24-hour, trading volume, down to $507.65 million, price action of late sees a mild recovery sentiment among traders if these Thai intentions are to be believed. The volume market cap ratio for TRON remains 1.94%, an indicator that while trading activity has slowed somewhat, liquidity levels are still good.
Technical Chart Analysis: Rising Wedge Shapes Near-Term Outlook
Looking closer at the TradingView 4-hour TRX/USDT chart, it appears that TRX is trading inside a rising wedge pattern. This is most often indicative of a bearish movement. Both upper and lower trendlines have been respected, while the price slowly remains in a tighter range.
Currently trading around the upper resistance of the wedge and just above the neckline at $0.2749, TRX is aiming for a breakout.
TRX, predicted to soon hit $0.3, has been in a consolidation phase since May 9, when it started a strong, steady climb from the $0.2560 range. Even with pullbacks, the price shows that it still remains within the channel of the rising wedge. Recent candles have produced a series of higher lows, which indicates continued interest from buyers on the lower volume on a series of decreasing momentum.
Volume analysis over the past several sessions has been decreasing, and the most recent volume delta readings are near equal on buys and sells. For example, buy volume slightly exceeded sell orders on May 26th, which wasn’t bullish but rather hopeful.
On the same 4-hour chart, the 14-period Relative Strength Index (RSI) is sitting at 57.95. TRX is in neutral to slightly bullish territory, but not overbought yet according to this level. Since May 24, when RSI bottomed near the 45 level beneath its bullish impulse, the RSI has been trending higher, which may be an indication of the return of bullish momentum slowly.
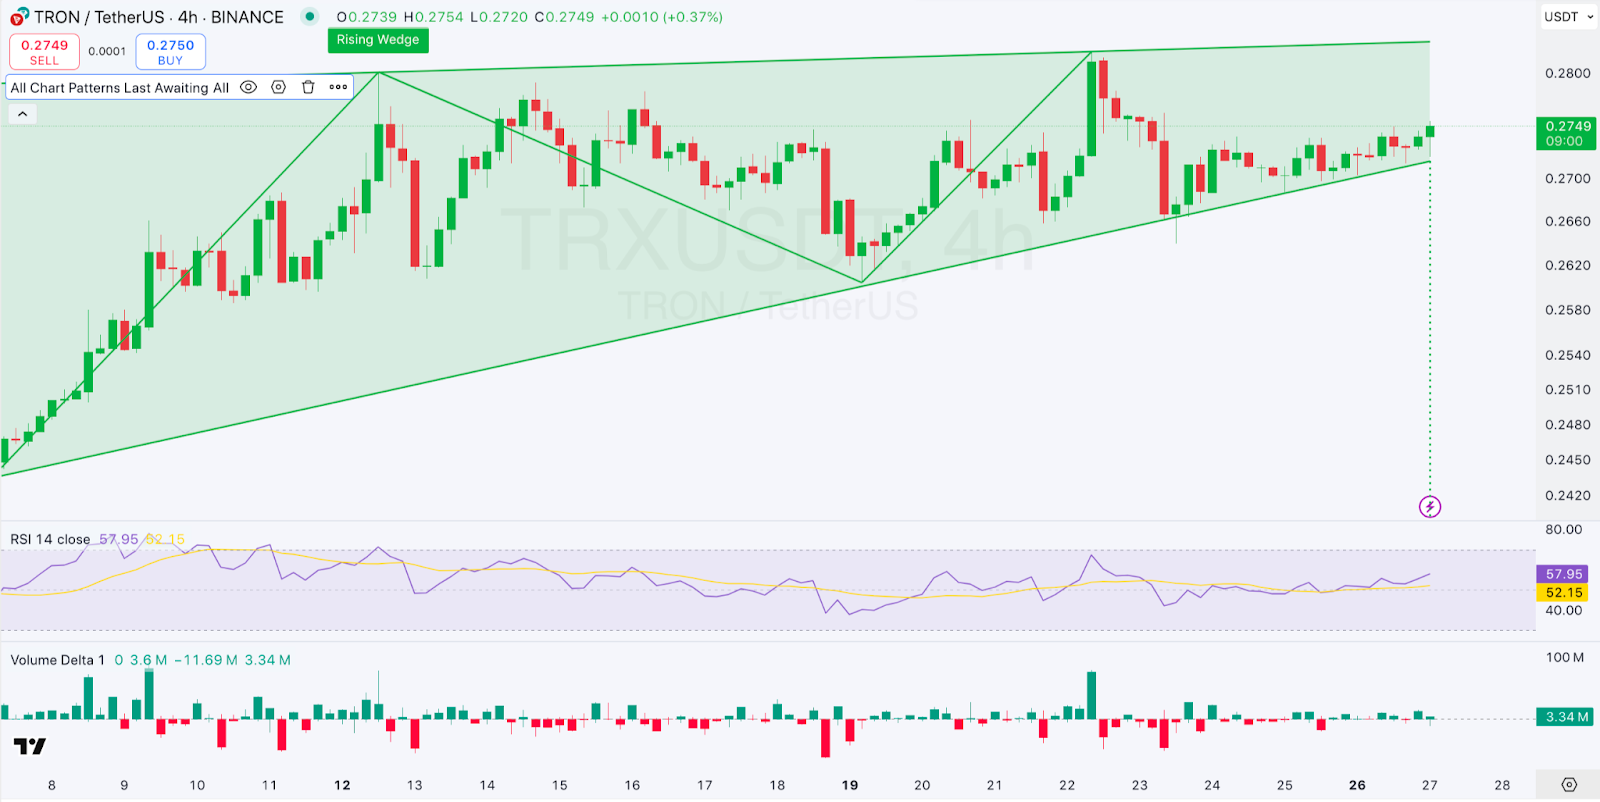
That said, with RSI readings yet to cross the 70 overbought threshold, there is still scope for higher up before the requisite reversal becomes statistically probable. It’s important to point out the fact that the upward momentum. Would have to take a strong breakout over the wedge. Likely resistance zone at $0.278, to negate the bearish implications of the pattern.
From a price structure point of view, TRX/USD, currently on a bullish structure. Will be targeting $0.2800 as its key resistance. Which coincides with the upper side of the rising wedge. An upside breakout around this area could trigger further upward movement to the psychological resistance of $0.3000. Which hasn’t been seen previously since the latter part of Q1 2025.
Traces of support come near $0.2680, the lower wedge boundary and more so near $0.2600. Which has been regularly bounced by the asset throughout May. However, should TRX fail to push above and instead lose this support. The next major retracement target will be a little closer, around $0.2420. This is where liquidity clustered in April.
Disclaimer
In this article, the views and opinions stated by the author. Or any people named are for informational purposes only, and they don’t establish the investment. Financial, or any other advice. Trading or investing in cryptocurrency assets comes with a risk of financial loss.



