
 Zylo Ecosystem
 Walrus
 Bitcoin
 Sui
Sui Quantus
 Quant
Quant Starknet

Key Insights
- Ethereum ETF inflows hit $78M as Bitcoin funds see $267M outflows.
- BlackRock shifts capital from BTC to ETH, signaling market rotation.
- Bullish chart patterns show ETH may soon target $2,800 and beyond.
BlackRock has reallocated a portion of its digital asset portfolio by selling $130.4 million worth of Bitcoin (BTC) and purchasing $48.4 million in Ethereum (ETH). This BlackRock Bitcoin move is drawing attention across financial and crypto markets as a possible signal of shifting institutional strategy.

Data from June 2 also supports this trend. Bitcoin ETFs saw $267.5 million in outflows, while Ethereum ETFs registered $78.2 million in inflows.
Capital Rotation Suggests Strategic Rebalancing by BlackRock
The decision by BlackRock to move capital from Bitcoin into Ethereum comes amid changing investor sentiment. The term “capital rotation” is used to describe the reallocation of funds between assets based on evolving expectations of risk, reward, or macroeconomic conditions.
BlackRock’s shift may indicate an institutional preference for assets offering utility in addition to store-of-value characteristics.
Ethereum’s functionality as a smart contract platform has increasingly attracted investor attention. The growing interest in decentralized finance, tokenized assets, and Layer 2 scaling solutions may have influenced BlackRock’s portfolio realignment.
ETF Flows Reflect Institutional Trends
According to reports, Bitcoin ETFs saw a total of 2,530 BTC sold. That’s equal to $267.5 million in net outflows. At the same time, Ethereum ETFs gained 30,810 ETH, resulting in $78.2 million in net inflows.

This divergence indicates a possible short-term reassessment of Bitcoin’s positioning in institutional portfolios. Some analysts interpret the trend as a temporary rotation. However, others see it as part of a larger transition toward Ethereum-driven exposure.
Fidelity also reportedly purchased $29.8 million worth of ETH, adding to the momentum behind Ethereum inflows.
According to analysts, these ETF movements may reflect positioning ahead of Ethereum ETF launches or broader confidence in the Ethereum roadmap. Institutional investors appear to be shifting toward assets with layered utility and broader infrastructure applications.
Ethereum Technical Setup Points Toward Potential Upside
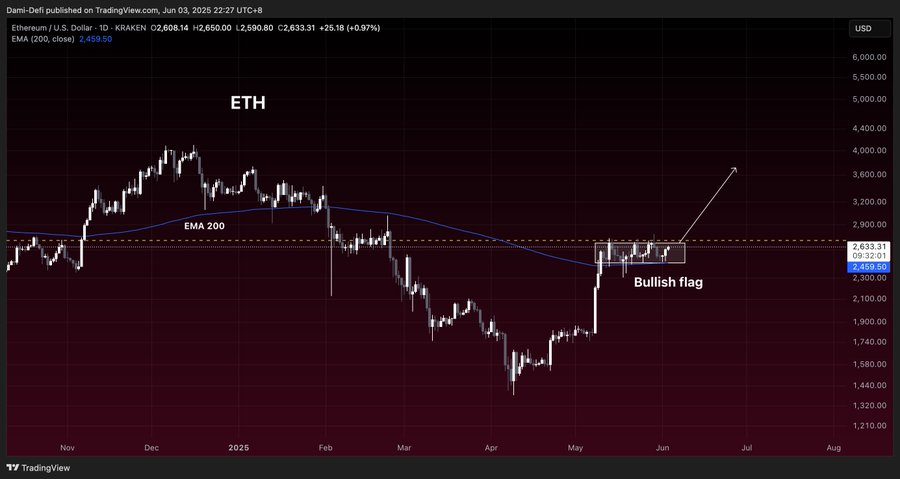
Many market analysts see common chart patterns that encourage a bullish view of Ethereum. According to technical analyst DamiDefi, Ethereum is sitting above the 200-day exponential moving average (EMA). ETH price is currently consolidating around $2,880, a significant resistance level.
If Ethereum ends the day above this point on the daily chart, bullish sentiment may improve. Ethereum price could even climb toward $3,200 or $3,500.
Market analyst CryptoGOGOS has also outlined Ethereum’s price pattern in an accumulation and re-accumulation cycle using a separate weekly chart. A broader look shows Ethereum trading in an accumulation area of around $1,600 to $4,000.
If the breakout stays in place, past Fibonacci levels set a conservative price goal of $3,960 and a bullish high toward $6,332.
The chart points out that ETH is currently above the middle point of this accumulation range, which points to a bullish trend. In this situation, Ethereum is ready to enter a phase where it grows rapidly, provided that the market is favorable to help demand keep rising through the ETF route.
Daily Chart Confirms Falling Wedge Breakout Toward $2,800
The latest daily chart of ETH/USD from Bitstamp confirms a breakout from a falling wedge formation, another bullish continuation pattern. Ethereum broke out of the wedge in mid-April and has maintained its upward trajectory since.
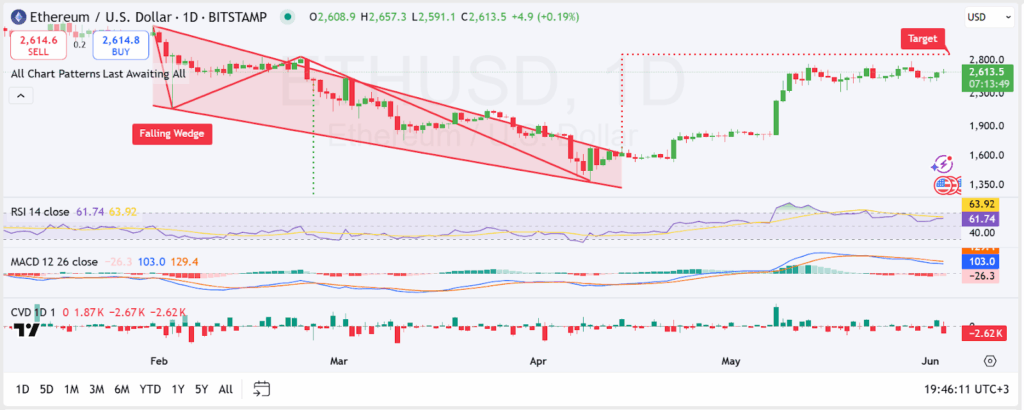
ETH was at $2,616.50 at press time. It is getting close to the breakout target of $2,800 on the chart. The RSI is 61.74, showing a strong surge of momentum but not entering the overbought area.
The MACD indicator is still at a positive value, yet is flattening. It hints that a short pause could happen before the next rise. The minor selling seen on CVD has not weakened the overall bullish trend.
Ethereum Continues to Outperform in 2025
In the past few weeks, Ethereum’s behavior has shown how it has become one of the leading cryptocurrencies. In the past month, ETH has done better than Bitcoin (+11%) and Solana (+10%), rising by 43%.
Higher values, increased cash coming into ETH, and positive technical indications indicate that Ethereum could lead the crypto market once more.



