no crying in the casino
 IGNITION
 Hood Sword Inu
 streamoors
 Altai the Tiger
 Sword Inu
 Pearl
Pearl

Key Insights:
- Whale net flows for PEPE surged 1,645% in 7 days, signaling strong accumulation activity.
- PEPE holds above the 50% Fib level at $0.0000122 despite a 4.8% pullback midweek.
- Derivatives data shows $1.97M in long liquidations, but funding remains bullish at 0.0091%.
PEPE coin traded sideways after a sharp midweek pullback. However, on-chain data revealed a surge in large-holder accumulation. The token remained above a key Fibonacci support level, suggesting that bulls might prepare for another upside push.
PEPE Coin Large Holder Net Flows Climb Sharply
IntoTheBlock data showed that the net flows of whale wallets have grown. Addresses that control over 0.1% of the PEPE supply grew by 1,645% in the last seven days. On June 11 alone, this figure hit 854.64 billion tokens. These movements indicate that large addresses are shifting holdings to accumulation.
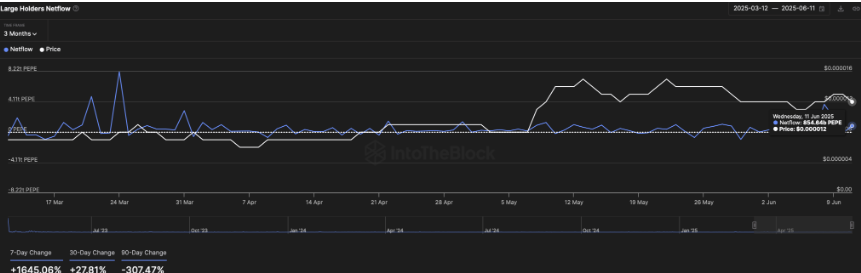
Consequently, the sudden surge in net inflow may be related to positioning ahead of technical support areas. Historically, a rise in whale net flows is associated with market recovery/price consolidation, particularly when the price behavior stalls around vital support areas.
Although the reason behind the inflows has not been established, the phenomenon has been consistent with past periods of PEPE Coin price rebound.
PEPE Coin Price Holds the 50% Fibonacci Level
As of the time of writing, PEPE Coin is priced at $0.00001242 after bouncing from a daily low of $0.0000121. This recovery places it slightly above the 50% Fibonacci retracement level, at $0.0000122.
Notably, the Fibonacci area was formed on the basis of the recent bullish leg since the low in May up to the local top in June. As a result, it is now a critical price level.
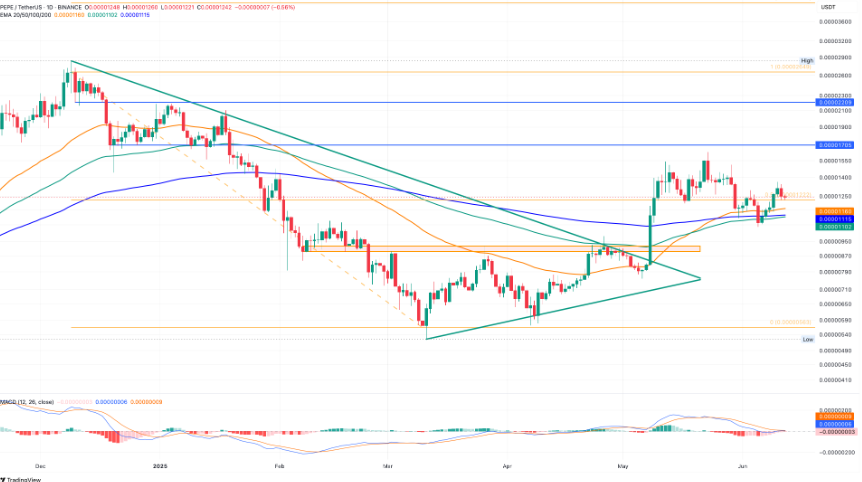
Earlier in the week, PEPE Coin declined by 4.80% in a trading session that was accompanied by high selling volume. In spite of this pullback, the bulls supported the 50% Fibonacci, indicating that there remains interest in maintaining the coin’s momentum in the medium term.
Additionally, the chart analysis indicated that PEPE Coin was above its 100-day exponential moving average (EMA), and a bullish crossover was recorded in the past sessions. This structure, along with recent whale behavior, allows the possibility of a wider extension to the resistance levels.
PEPE Coin Price Target and Resistance Levels in Focus
More so, the technical analysis indicated that if PEPE Coin continued to hold the 50% Fibonacci support, the next short-term target lies near $0.00001550. Beyond that, resistance may form near $0.00001705, which was previously tested during late May. A sustained breakout above this zone could create the conditions necessary for a test of $0.0000286 in a bullish extension scenario.
On the downside, a breakdown in keeping the support at above $0.0000122, might bring the 200-day EMA at $0.00001155 into play. This would be a challenge to the new bullish structure. The short-term direction will depend on the way the token will react to these levels, with the changing volume and whale accumulation trends.
Bullish Sentiment in Derivatives Despite Long Liquidation Spike
Meanwhile, the derivatives market data for PEPE Coin showed mixed activity. According to Coinglass, open interest increased by 0.30% to $577.44 million, indicating ongoing speculative participation.
However, long liquidation volumes rose to $1.97 million over the past 24 hours, more than double the $920,000 in short liquidations during the same period.
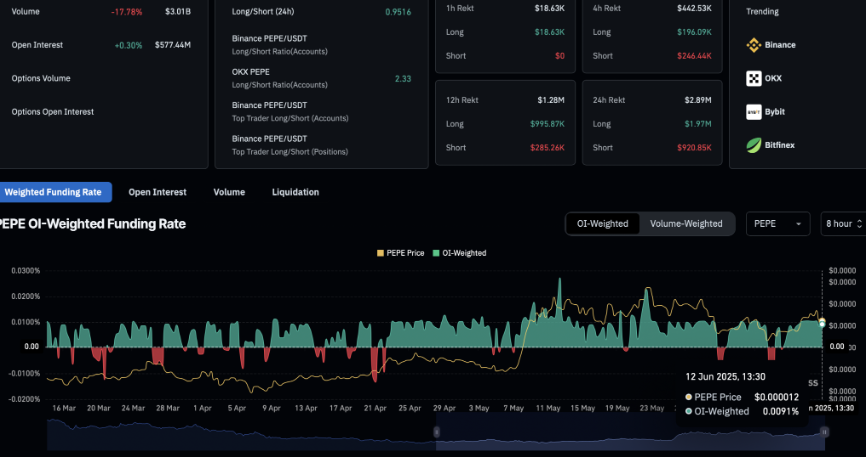
The increase in long liquidations signals a short-term flush of overleveraged positions, but not a major shift in trend. The long/short ratio dipped slightly to 0.9516, suggesting mild bearish pressure.
Still, funding rates remained positive at 0.0091%, implying that traders continue to pay to maintain long positions—an indication of broader bullish bias despite recent volatility.
Disclaimer
This article is for informational purposes only and provides no financial, investment, or other advice. The author or any people mentioned in this article are not responsible for any financial loss that may occur from investing in or trading. Please do your research before making any financial decisions.