Zylo Ecosystem
 Pearl
Pearl Walrus
 Derive
 Quantus
 Aerodrome Finance
 Sui
Sui

Key Insights:
- MicroStrategy’s Bitcoin strategy drives an unmatched 3,150% return in markets.
- Nvidia and Bitcoin trail MSTR despite strong tech performance.
- Bond market suffers losses while crypto-linked equities outperform peers consistently.
MSTR stock has become the best-performing asset of all the large technology and financial instruments. It has seen an outrageous overall increase of 3150%. This has given it more than all other major equities and assets over the same period.
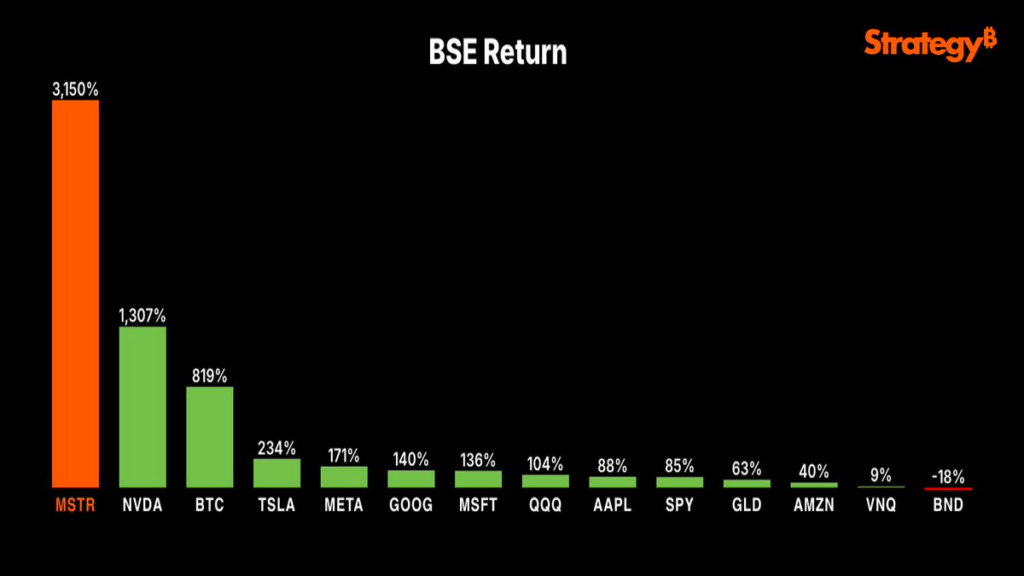
According to the BSE Return chart, MicroStrategy has outperformed major assets like Nvidia, Bitcoin, Tesla, and Apple. Its aggressive Bitcoin acquisition strategy has played a key role in this surge.
Investors increasingly view MSTR stock as a proxy for Bitcoin exposure. This perception has fueled strong bullish momentum in the stock’s performance.
MSTR Stock Leads Performance Chart with 3,150% Return
The bar graph shows that MSTR stock is clearly in the category as the asset overshadows others on the chart. MicroStrategy’s 3,150% surge far exceeds Nvidia’s 1,307% gain. It also outpaces Bitcoin’s impressive 819% rise over the same period.
It currently holds more than 597,000 BTC in its balance sheet, which has a value of more than $64 Billion. The company needs to be considered more like a corporate Bitcoin treasury than a software intelligence firm.
On June 30, 2025, MSTR stock, which ended 2024 in a bang, reported buying BTC in its latest purchase of 4,980 BTC. They bought the primary coin at an average price of $106,801.
This was described as part of its overall capital plan dubbed 42/42 to support further BTC acquisition up to 2027. This highly active strategy to acquire Bitcoin has accompanied significant equity capital raises.
Strategy’s use of STRK and STRF equity shares has strengthened its balance sheet significantly. These offerings have also attracted investors by providing tailored exposure to Bitcoin and stable income options.
Bitcoin fails to make it in the list of companies in the chart that boast a much better 819% return. Bitcoin (BTC) has long been considered one of the most volatile assets in the financial world. Despite its risks, it remains highly promising due to its potential for massive returns and adoption.
MicroStrategy’s valuation reflects strong investor confidence in its long-term crypto strategy. The company holds unrealized Bitcoin gains worth $21 billion, with an average purchase price of $70,982 per coin.
NVDA Surges 1,307%, Outpaces Bitcoin and Tech Peers
Nvidia’s 1,307% surge underscores its AI and data center innovation leadership. Its GPUs are the backbone of top AI platforms like ChatGPT, Google Gemini, and Meta LLaMA.
Demand for AI acceleration chips has surged, fueling Nvidia’s rapid growth. This explosive momentum has pushed its valuation to record-breaking levels.
82% of Nvidia’s profits were realized during after-market hours and global trading intervals between March 2024 and February 2025. This highlights the intensity of after-market and international trading.
This pre-market interest suggests increased institutional and retail demand for AI-associated stock exposure. Aside from MSTR stock, BTC, and NVDA, most large tech stocks show a steadier and more balanced growth trend.
However, their performance appears relatively monotonous compared to the standout gains of the top three. Tesla (TSLA) came in at 234%, then Meta (META) at 171%, Google (GOOG) at 140%, and Microsoft (MSFT) at 136%.
Sectoral trends oriented all of these companies. This includes the adsorption of AI, cloud services, and rebound digital advertising.
Stock Market Performance
The QQQ ETF, tracking the Nasdaq-100, has rebounded by an impressive 104%. Apple (AAPL) gained 88%, while the S&P 500 (SPY) rose 85% over the same period. These returns lag behind crypto-exposed assets but still show solid performance.
Investor confidence in U.S. tech mega-caps remains strong and unwavering. Amazon (AMZN) has posted a modest 40% return, trailing its tech peers.
This is likely due to slower AWS growth and fierce competition from Microsoft Azure and Google Cloud. In the meantime, GLD, an ETF based on gold, grew by 63% better than AMZN. However, not as high as tech equivalents.
The chart was a visualization of the poor performance of bonds and real estate. Vanguard Real Estate ETF (VNQ) experienced a slight rise of 9%.
This illustrates the difficulties in the commercial real estate business with increased interest rates. It also shows that the popular workplace is far away and has less office demand.
The worst performing was especially the significance of the bond market symbolized by BND, with an adverse return of -18%. The loss represents the overall weakness of fixed-income assets in a high-interest-rate market.
Concerns over inflation have led the Federal Reserve to maintain elevated interest rates. As a result, bond values have plunged due to reduced investor demand and rising yields..Superior bonds with high yields have gained greater interest from investors.
Disclaimer
This article is for informational purposes only and provides no financial, investment, or other advice. The author or any people mentioned in this article are not responsible for any financial loss that may occur from investing in or trading. Please do your research before making any financial decisions.