Bitcoin
 Aerodrome Finance
 Zerebro
 Starknet
 Zama
Zama Pearl
Pearl ZKsync
Key Insights:
- XRP price formed an inverse head-and-shoulders pattern on the 4H chart, signaling a potential 12% breakout toward $2.60.
- CoinGlass data shows nearly all XRP leveraged short liquidity cleared, except a major wall at $2.36.
- XRP has bounced from $2.02 and is approaching the $2.36 resistance zone, aligning with a bullish continuation setup.
XRP price was in a critical phase following the technical and liquidity indicators leveling off below the $2.36 resistance. A recent pattern formation and liquidation data convergence was observed, as it may determine the next price turning point.
XRP Price Inverse Head-and-Shoulders Pattern
Recently, XRP price has formed an inverse head-and-shoulders pattern on the 4-hour chart, a technical pattern commonly deployed in projecting a bullish turnaround. The pattern consisted of a well-mounted left shoulder, a lower trough to form the head, and a higher low to form a right shoulder. The neckline was positioned at the $2.33 to 2.36 range, and the ongoing price is approaching this level.
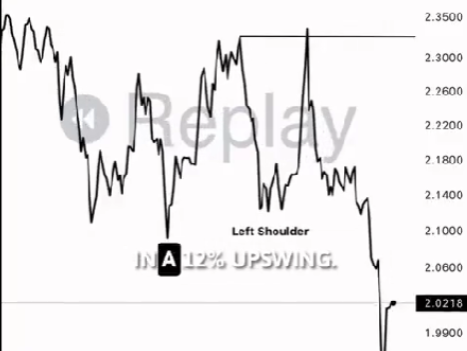
Notably, chart data shared by analyst Ali Martinez suggested XRP price broke above this neckline temporarily, implying bullish momentum is beginning to take shape.
Consequently, if the breakout sustains, this formation’s projected target is approximately $2.60. The distance between the head and the neckline, applied from the breakout point, gave an estimated 12% potential rise.
Bounce From $2.02 Strengthens Bullish Continuation Outlook
Moreover, XRP’s price has since staged a local recovery after dipping to a low of $2.02, ensuring it sustains a bullish run. The action was in higher context bullish continuation patterns, particularly in combination with the inverse head-and-shoulders breakout.
Furthermore, this rebound was amidst mixed indications in the wider market, making the separate set-up of XRP more visible. As the XRP price rested at the neckline of the breakout zone, Ali evaluated how pressing follow-through buying can break above the $2.36.
Besides, the volume levels and the depth of order books may be especially important in determining whether the breakout could extend to the $2.60 mark.
Leverage Liquidity Data Shows Cleared Zones Below $2.36
According to CoinGlass liquidation heatmaps, nearly all short positions below the $2.36 price level have already been wiped out. This showed that a lot of the intermediate resistance caused by highly leveraged traders has been removed.
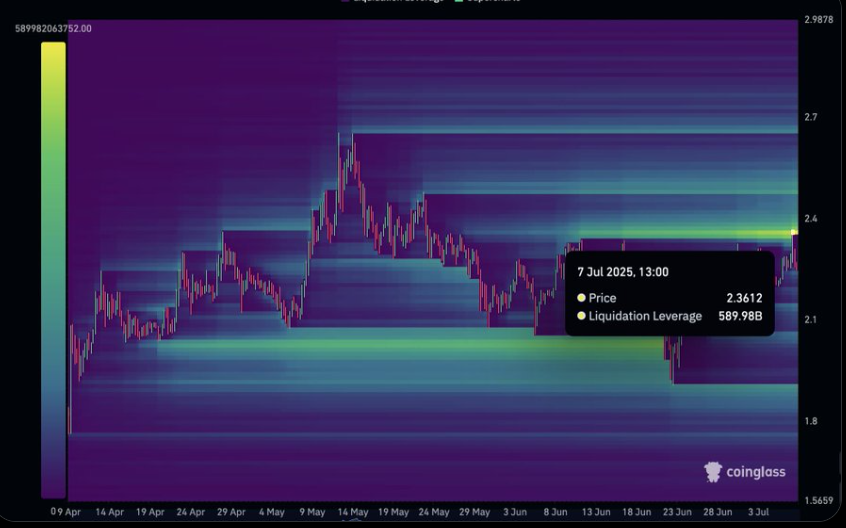
Subsequently, the lack of liquidation pointed directly below the existing level lowers negative friction and implying the position should have been exhausted.
The heatmap showed an abrupt accumulation of leveraged orders around the $2.36 level, implying that it is a last-resistance wall. This cluster was the final space of heavy liquidation leverage, almost 590 billion dollars.
As a result, should the XRP price break this level, there would be very little overhead pressure in the short term, enabling a surge towards the higher levels.
XRP Breaks Downtrend as RSI Signals Bullish Shift
Another analyst, Niels, has drawn attention to the XRP price breakout from a seven-month downtrend, positioning the token as a potential altseason trigger. The weekly chart showed a clear descending trendline breached by a recent candle near the $2.36 zone, confirming a structural reversal.
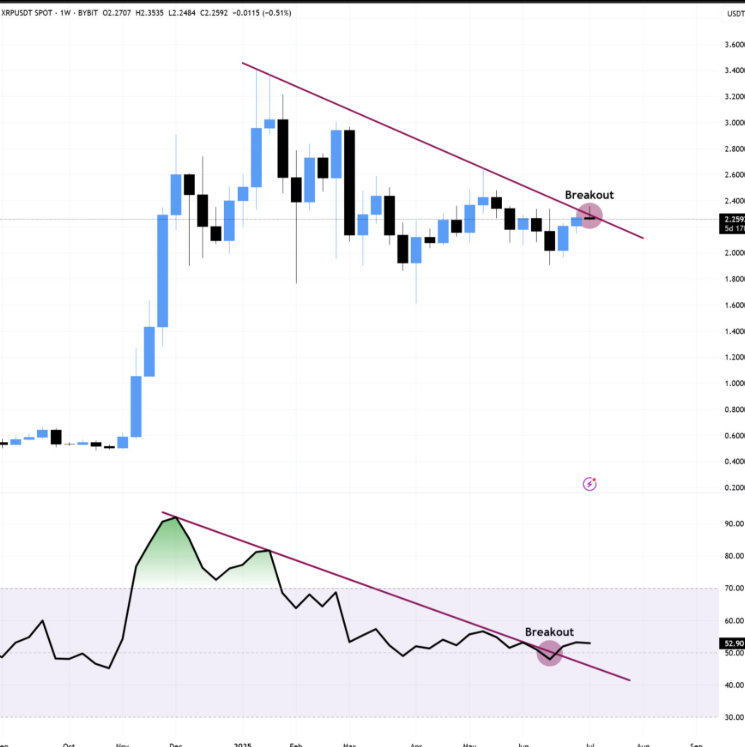
Relative strength index (RSI) below the price chart had also broken through its downward trendline, breaking to a higher 52.90, a sign of renewed strength. Niels mentioned that large rallies had preceded prior RSI breakouts experienced by XRP. A weekly close above $2.40 would confirm a bullish continuation, aligning with broader altcoin momentum shifts.
Further supporting a bullish outlook, a recent analysis showed XRP price trading within a descending wedge, a pattern often followed by upward moves. With a price of $2.25 and a trading volume surging by over 126%, momentum appeared to be building. Technical indicators like RSI and MACD also supported a continued upside, with targets set as high as $4.60.
Disclaimer
This article is for informational purposes only and provides no financial, investment, or other advice. The author or any people mentioned in this article are not responsible for any financial loss that may occur from investing in or trading. Please do your research before making any financial decisions.