
 Zylo Ecosystem
 Walrus
 Bitcoin
 Sui
Sui Quantus
 Quant
Quant Starknet

Key Insights:
- Dogecoin forms a bullish double bottom pattern, signaling recovery.
- Whale accumulation and technical indicators suggest a potential breakout.
- The derivatives market shows reduced activity, indicating cautious sentiment.
Despite declining options open interest, Dogecoin price path to a key level remains possible if it breaks key resistance levels and maintains support. However, as of today, the price of Dogecoin (DOGE) stands at $0.1694. It marked a -1.10% decline over the past 24 hours.
In the past week, DOGE has seen a modest recovery, with a 5.04% price increase. Will Dogecoin hold key support?
Crypto Analysts’ View on Dogecoin Price
Amid this short-term calm, Tom Tucker, a well-known analyst on X, has recently pointed out a technical formation that could signal a bullish reversal for Dogecoin. His chart analysis identifies a classic double bottom pattern developing on DOGE/USDT’s daily price action.
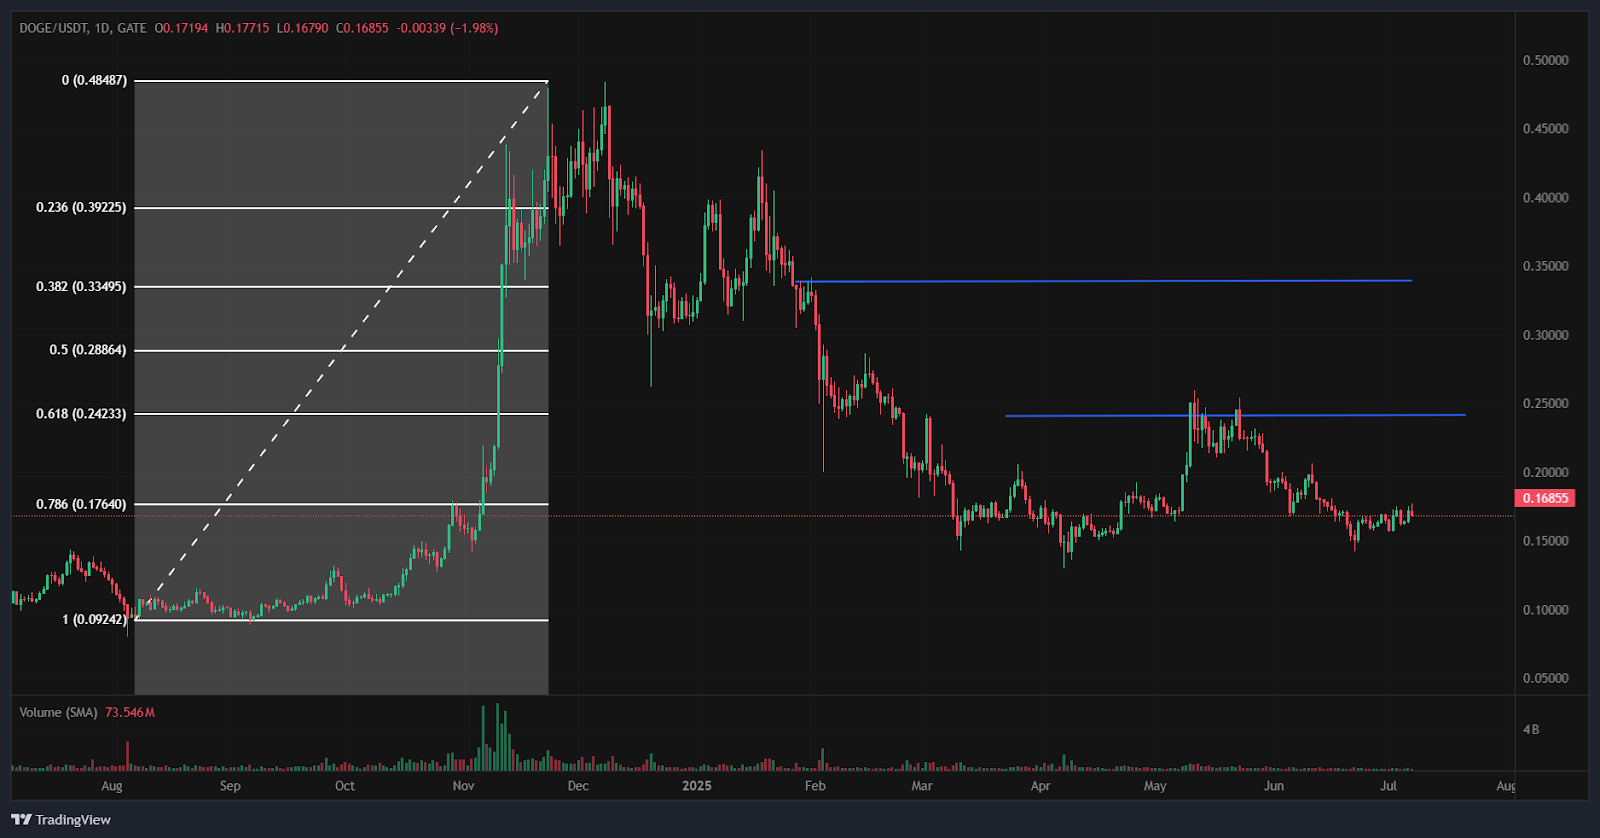
This chart setup suggests that DOGE is at a crucial juncture, with the price potentially poised for an upward breakout. The double bottom pattern, often considered a strong bullish reversal signal, has formed near a robust support level at $0.1467.
The two key low points in this pattern occurred on April 7, 2025, at $0.1299, and on June 22, 2025, at $0.1437, with both instances seeing price rebounds around the same support level. It suggests that buying interest has consistently emerged at this price point, helping to solidify the support.
The neckline of the double bottom is at $0.2596. So, a confirmed breakout above this level could lead to a significant price rally.
Supporting this view, momentum indicators such as the RSI and MACD are showing signs of improvement. The RSI is currently above 47, approaching the neutral point, indicating that selling pressure may be easing.
The MACD has also undergone a bullish crossover, with the MACD line now above the signal line. It further suggests upward momentum.
Additionally, whale accumulation is on the rise, with large holders increasing their positions. It is often considered a positive sign for price stability and potential growth.
Fibonacci Retracement Levels and Potential Price Targets
To get a more detailed idea of possible resistance and support, the analysis provided by Tucker adds Fibonacci retracement levels. Those levels are obtained based on the Swing low of $0.09242 and the Swing high $0.48487 to assist in determining areas that can either provide resistance or support.
When writing, DOGE’s price was situated just below the 0.786 Fibonacci level at $0.17640. It was acting as immediate resistance.
When Dogecoin price succeeds in breaking that level, the other strong resistance would be the 0.618 Fibonacci level at $0.24233. It goes hand in hand with the neckline of the double bottom pattern. Besides, this is where much notice of any possible bullish continuation should be taken.
In the event of a surge on DOGE to further highs, the 0.5 Fibonacci level of $0.28864 and the 0.392 level of $0.33495 can be upside targets. Nevertheless, as long as DOGE price does not fall below the $0.1467 support level, it always has an open way to attain $0.2596 and more.
Ascending Broadening Wedge Pattern Analysis
Adding another layer to the technical analysis, Trader Tardigrade also pointed to another formation on DOGE’s chart, to be precise, the Ascending Broadening Wedge Pattern.
The trend in this pattern is marked by the existence of two trendlines sloping in two different directions, and with the price rebounding on the support trendline which in the past has been able to hold price at different levels.
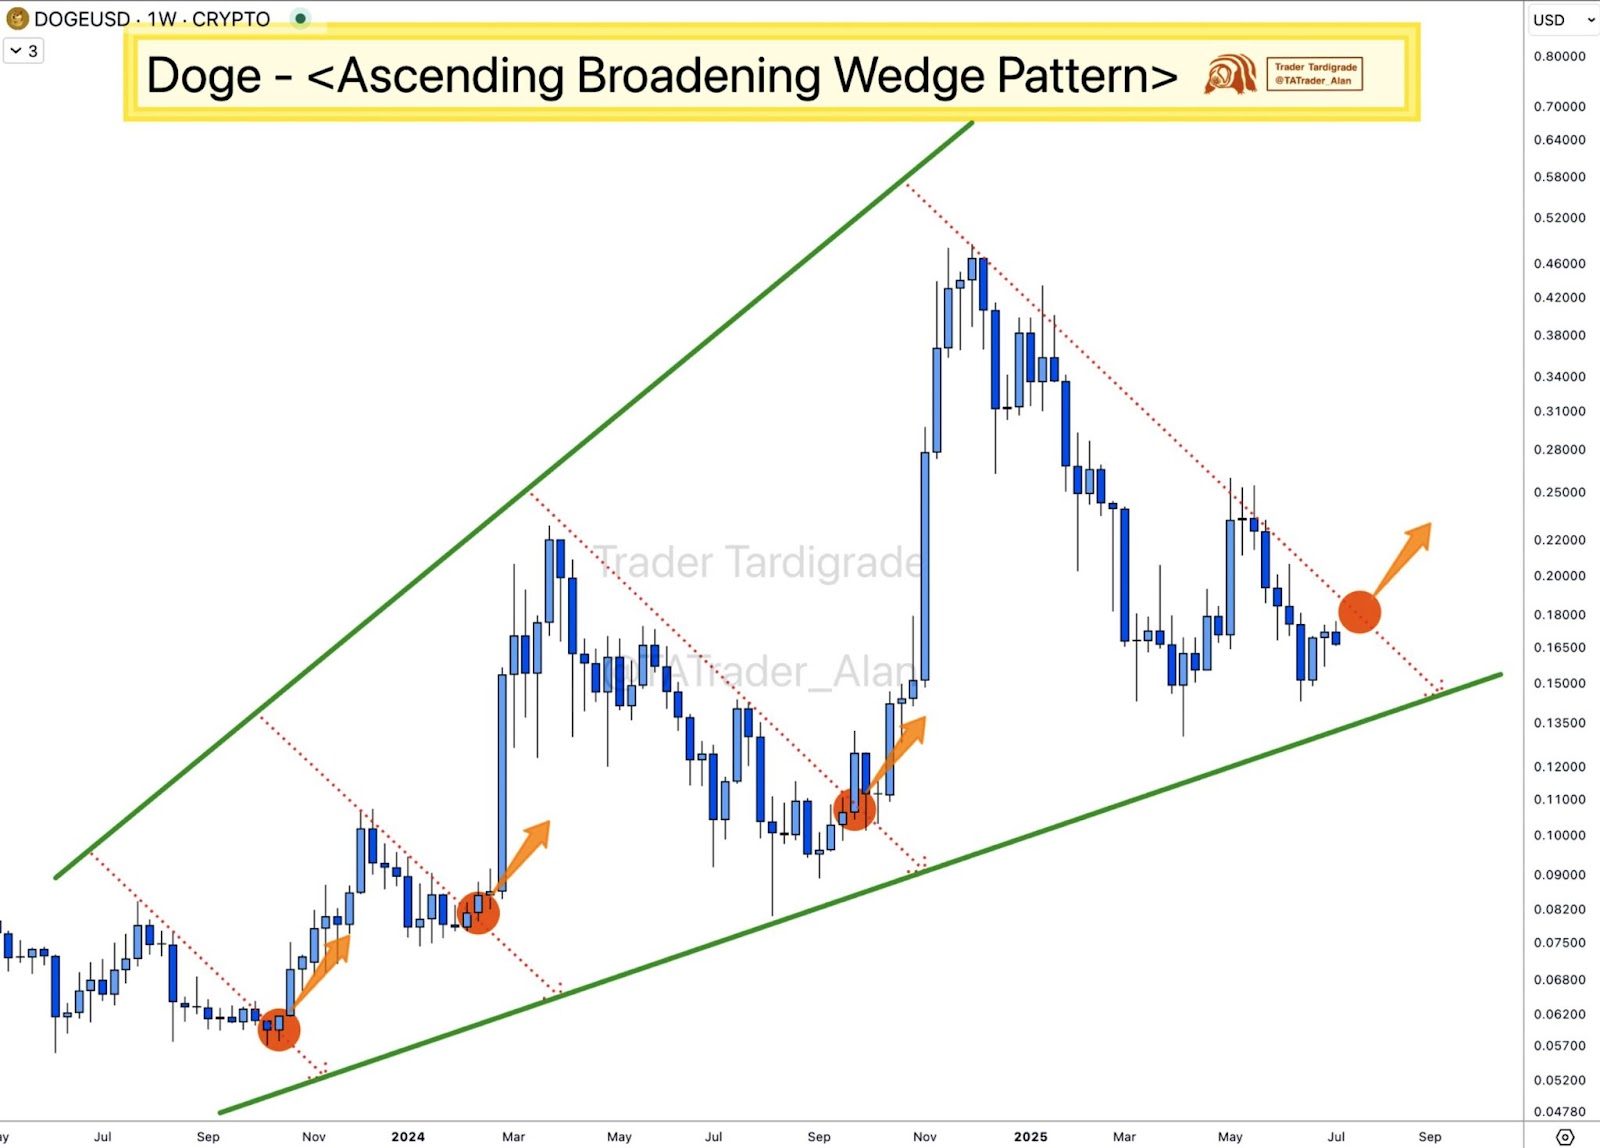
Notably, in October 2023, February 2024, and September 2024, the price found support at these levels. That indicates a general upward bias. The recent bounce at this support suggests that DOGE could be on the verge of another move toward the resistance trendline.
However, the price has consistently struggled to break through the resistance trendline, typically around the $0.18 range. It suggests that DOGE is experiencing high volatility, as the expanding support and resistance zones create a volatile trading environment.
A breakout above the resistance line could signal a bullish rally, with potential targets around $0.20–$0.25 by mid-2025. If DOGE can maintain support above the $0.15–$0.16 range, the formation implies that the crypto may continue its gradual rise, even above $0.30.
DOGE Derivatives Market and Trading Behavior Insights
Turning to the derivatives market, CoinGlass data reveals a significant decrease in trading activity for DOGE futures and options. Volume has dropped by 27.97% to $3.61 billion. It indicates lower activity compared to previous periods.
This decline in volume could also point to market participants waiting for clearer direction before committing to new positions. Likewise, open interest has decreased by 3.25% to $2.02 billion.
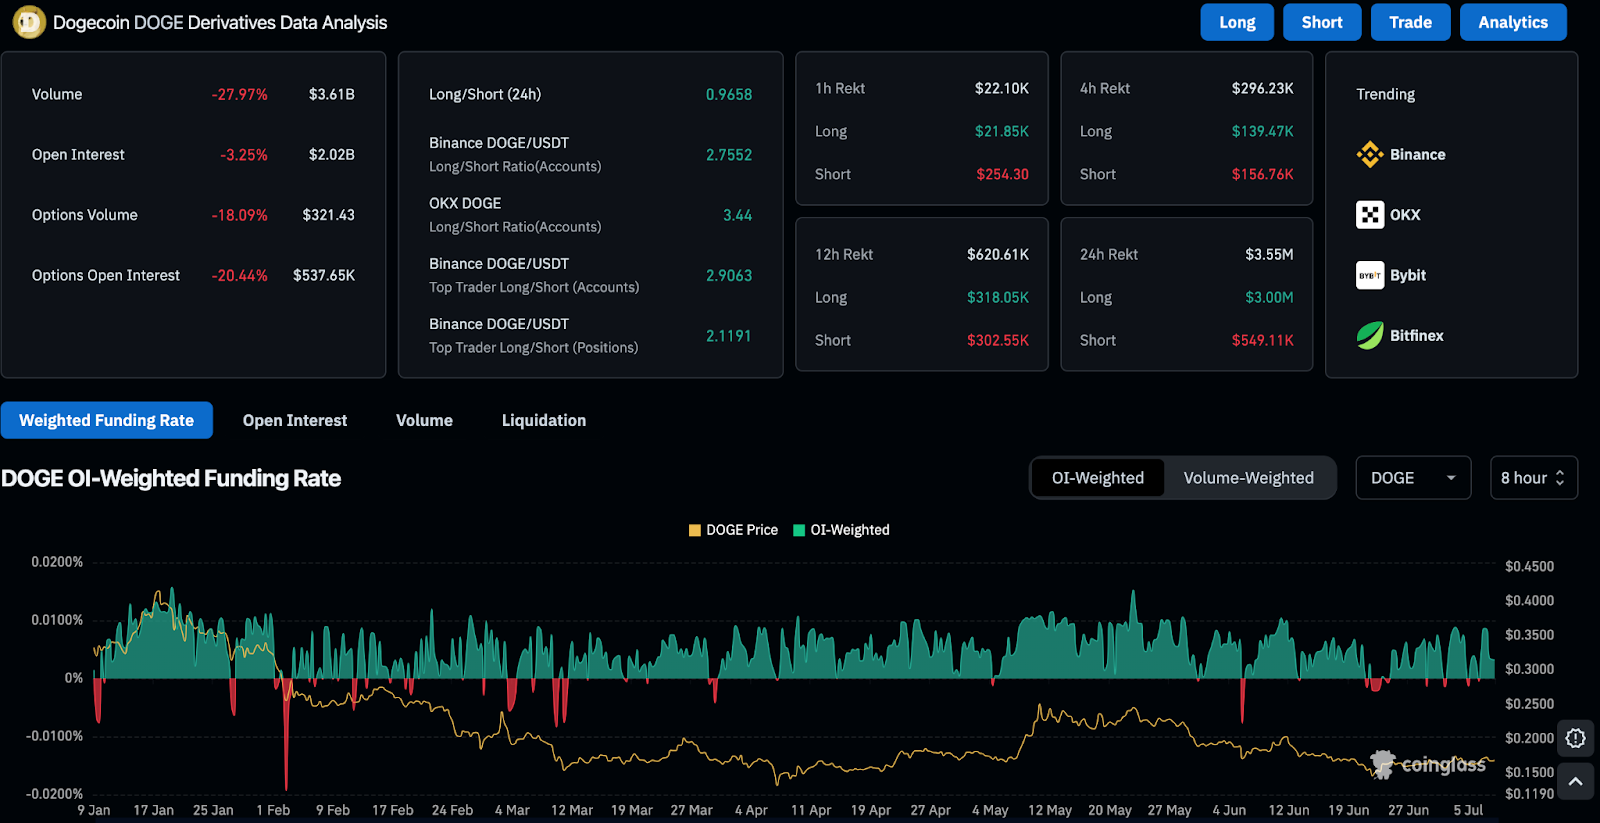
The options market also shows signs of reduced speculative interest. The options volume is down by 18.09% to $321.43 million, and options open interest is falling by 20.44% to $537.65 million.
This decline suggests a more cautious approach from traders in the options space. In the past 24 hours, long positions accounted for $3 million of the $3.55 million in total liquidations.
Disclaimer
This article is for informational purposes only and provides no financial, investment, or other advice. The author or any people mentioned in this article are not responsible for any financial loss that may occur from investing in or trading. Please do your research before making any financial decisions.



