streamoors
 Injective
 Pudgy Penguins
 Celestia
 Pearl
Pearl Sui
Sui Bitcoin

Key Insights:
- PEPE coin price broke a long-term descending trendline on both 12H and daily charts, confirming a potential bullish reversal setup.
- The 12H chart shows higher lows and compression near the breakout, signaling growing buyer strength and upward pressure.
- Analyst targets the $0.00001700–$0.00002000 zone if PEPE coin price sustains momentum above resistance.
PEPE coin price has confirmed a breakout after a few weeks of consolidation in a descending trendline. The meme coin price trend has changed to the buyers’ side.
Also, the technical analysts reported bullish patterns at various time frames. The anticipated breakout might head to the $0.00001700 target.
PEPE Coin Price Breakout Confirmed on Both 12H and Daily Timeframes
Notably, the PEPE price broke a descending trendline on the 12-hour and daily charts. The trendline has resisted the meme coin since June. Also, the beginning of July has finally broken with a strong bullish candle.
On the 12-hour chart, PEPE coin price had consolidated just beneath the trendline, with increasing lows. Such a compression phase showed bullish power within the market, with sellers losing.
The breakout created an opportunity for a long run and action upwards. However, a confirmation may be essential for further price stability and volume protection.
Higher Lows and Compression Support Bullish Bias
A crypto analyst identified an ascending triangle, a bullish breakout pattern. PEPE coin price made higher bottoms in successive weeks as the meme coin tried the same resistance point.
It also generated the effect of compression. This formation can develop a lot of momentum closer to the triangle’s apex.
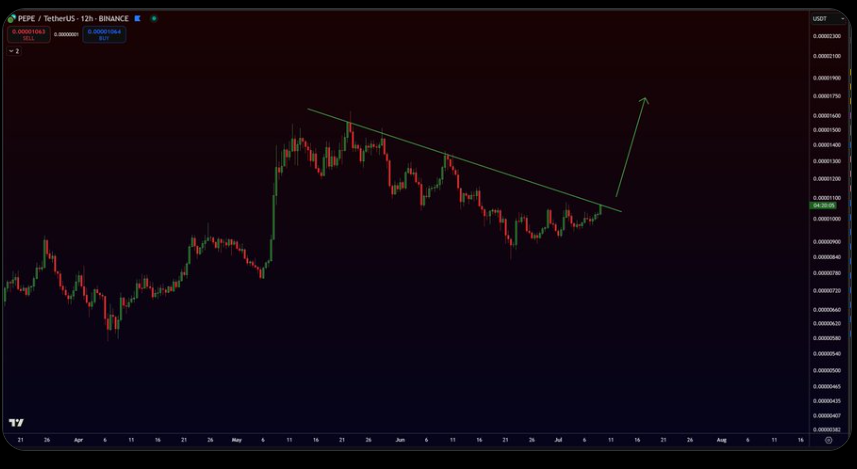
Furthermore, the breakout in this setup was done at a moderate volume. Also, the PEPE price broke the trendline, then sustained gains above $0.00001100.
The higher lows suggested continued accumulation in the downtrend as buyers got involved. This pattern was inclined to trend continuation if the breakout is maintained during the following sessions..
Resistance Reversal at $0.00001123 Opens New Targets
More so, technical analyst İnanç Salman shared a daily chart showing the breakout of the descending trendline. He also identified a target zone near $0.00001700. The projection is based on prior price reactions and supply areas formed in May.
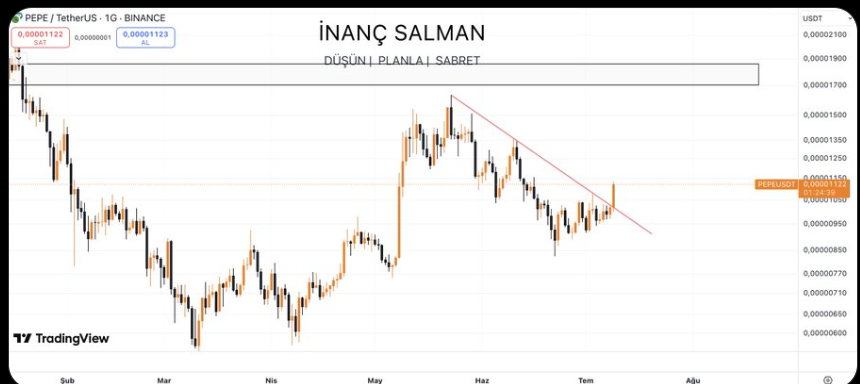
As of writing, PEPE coin price was trading near $0.00001123, a level previously acting as short-term resistance. Flipping this level into support would be crucial for bulls to extend the rally. Analysts now watch for price acceptance above this threshold before mapping further targets.
Should it maintain its momentum, the next target zone is between $0.00001700 and $0.00002000. This zone coincides with the old supply zones of mid-May, where the recent rally met resistance.
A major catalyst toward these higher prices may be sustained volume and stability above the $0.00001100 mark. Further supporting a bullish breakout, recent analysis showed PEPE reclaiming the Ichimoku Cloud on the weekly chart.
This indicator previously marked the start of a strong rally in late 2023. With RSI rising above the 50 level and MACD showing a flat pattern, the technical setup suggests weakening bearish pressure. These signs point to increasing chances of bullish momentum building up.
PEPE Derivatives Surge as Bulls Gain Market Control
Meanwhile, PEPE derivatives volume increased 51.03 percent to 3.22 billion. At the same time, open interest grew by 11% to $602.74 Million, signifying high market engagement.
The Binance long/short ratio was 1.0488 (24-hour), whereas OKX was more optimistic by 1.53. This indicated increased interest by traders as PEPE broke resistance levels.
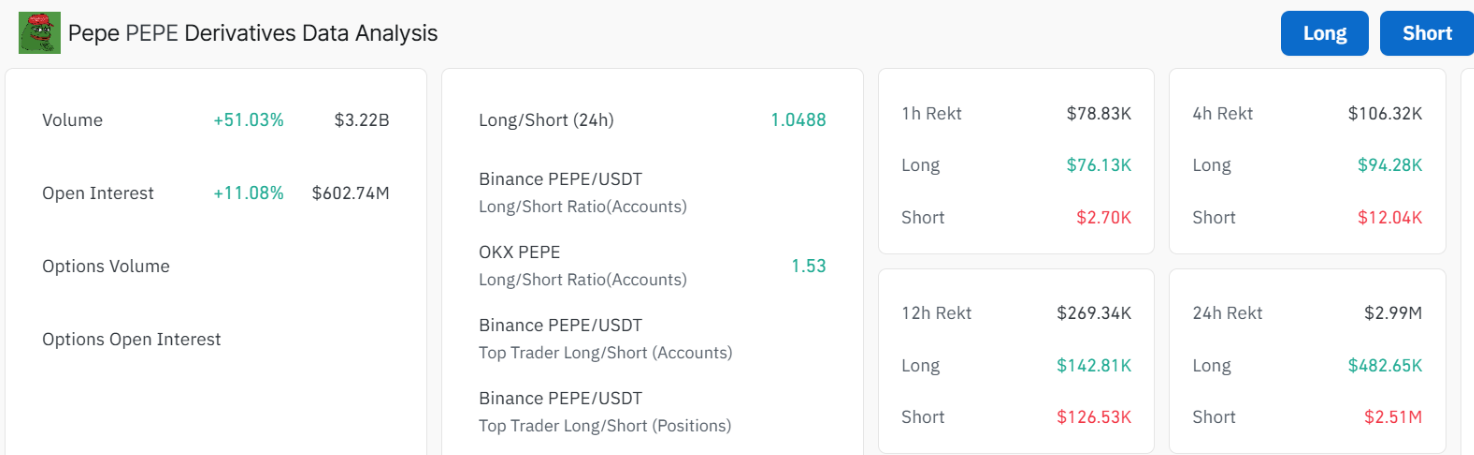
Liquidation data reveals that short traders took heavier losses, totaling $2.51 million over the past 24 hours. In contrast, long positions faced only $482.65K in liquidations, highlighting bearish pressure relief.
The 12-hour chart showed balanced pressure, $142.81K in long liquidations and $126.53K in shorts. Rising volume and positioning shifts suggested bullish traders were increasingly confident in short-term upward momentum.
Disclaimer
This article is for informational purposes only and provides no financial, investment, or other advice. The author or any people mentioned in this article are not responsible for any financial loss that may occur from investing in or trading. Please do your research before making any financial decisions.