Pearl
Pearl ZKsync
 Bitcoin
 Starknet
 Quantus
 Puffer
 Lighter

Key Insights:
- Bitcoin dropped to $115K amid $675M crypto liquidations.
- BlackRock, Fidelity, VanEck acquired $185.7M in BTC during the dip.
- IBCI enters distribution zone, flashing short-term correction warning.
Bitcoin price dropped to $115K following $675M in crypto liquidations, while BlackRock, Fidelity, and VanEck bought $185.7M in BTC. Analysts flagged a possible short-term top as the IBCI entered a warning zone tied to past cycle peaks.
Smart Money Loads Up While Retail Traders Get Wiped Out
Bitcoin (BTC) fell to a 7-day low on July 25, dropping to $115,000 as market-wide liquidations surged. The price drop coincided with increased whale accumulation, including a $185.7 million BTC purchase by BlackRock, Fidelity, and VanEck.
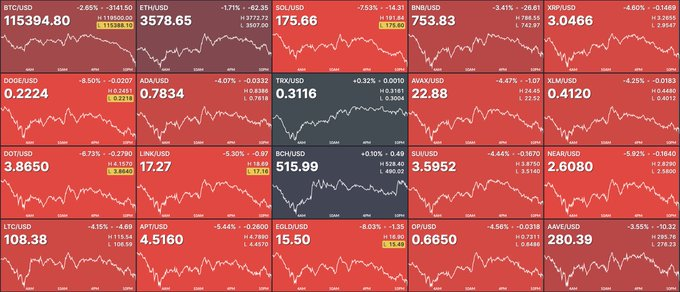
Data from TradingView shows BTC retraced sharply from the $123,000 high it posted earlier this month. At press time, BTC trades near $115,600, marking a 2.28% daily drop. The latest slide wiped out over $675 million from the crypto market in 24 hours, per data shared by Crypto Rover.

Market commentor and analyst Crypto Rover noted that BlackRock, Fidelity, and VanEck had collectively bought $185.7 million worth of BTC. The activity suggests coordinated accumulation from institutions during the dip.
Distribution Zone Warning From IBCI Analyst
While whales appeared to accumulate, caution emerged from cycle indicators. Anonymous crypto analyst Gaah flagged the Index Bitcoin Cycle Indicator (IBCI) entering the distribution zone—a technical region historically associated with interim tops.
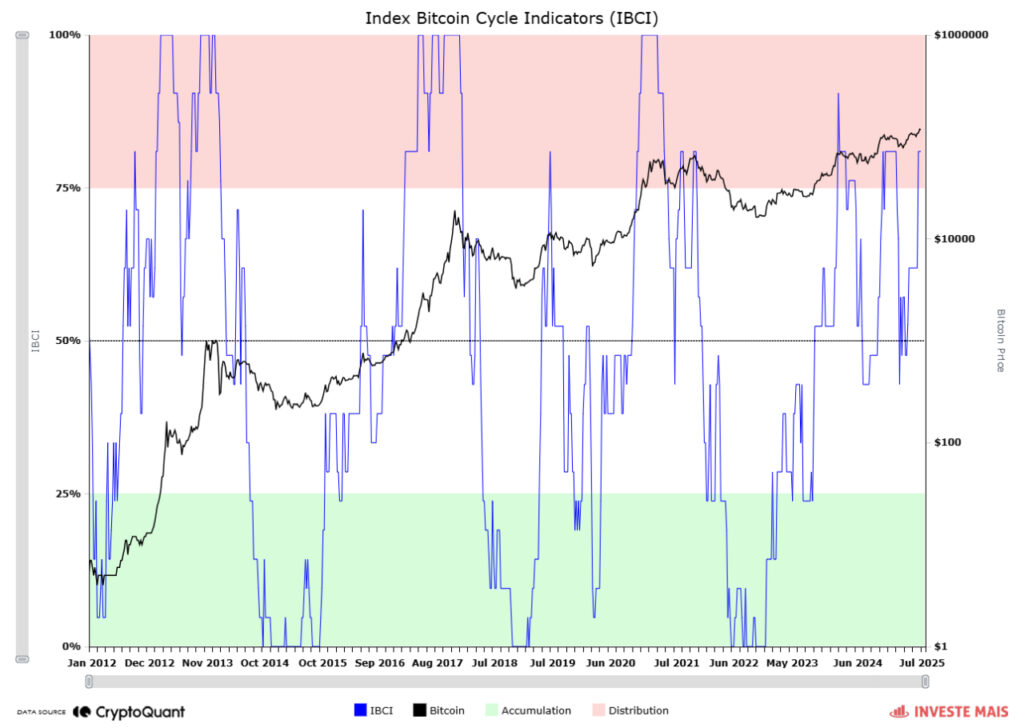
“This is the third time IBCI has entered this zone in the current bull cycle,” Gaah stated. Although the index hit only the lower boundary at 80%, rather than the 100% seen in previous tops, Gaah warned of elevated corrective risk.
“The behavior of the IBCI offers an important warning sign: we are in a zone of high corrective risk in the short term, but not necessarily at a major end-of-cycle top,” the analyst said.
Other indicators including the Puell Multiple and STH-SOPR (Short-Term Holder Spent Output Profit Ratio) remain below peak euphoria levels, suggesting room before a full macro top is in.
Bitcoin Technical Breakdown Tests Bullish Momentum
BTC’s price structure on the daily chart shows signs of exhaustion. The ascending wedge that formed from May to mid-July broke downward, with BTC dropping from near $123,000 to under $116,000.
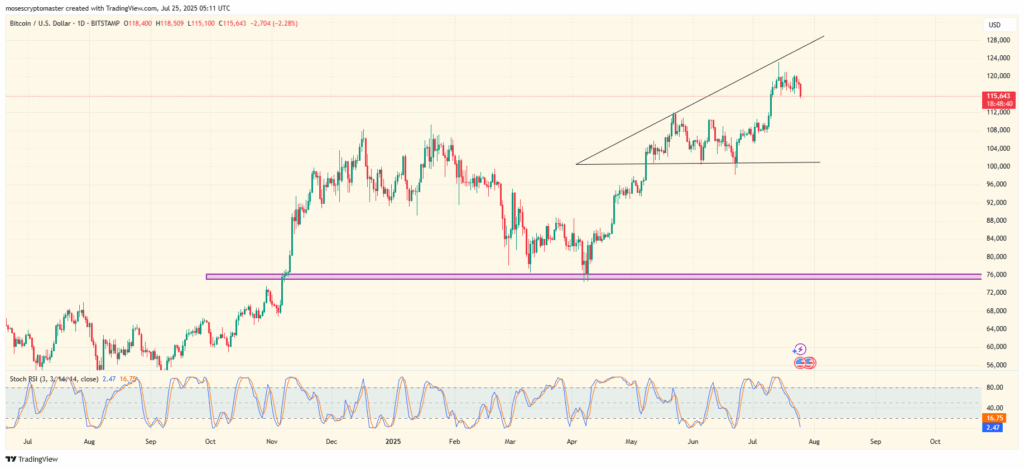
Stochastic RSI confirms a cooling phase. At press time, the indicator sat at 2.47 with a signal line at 16.75, signaling extreme oversold conditions on the lower timeframes.
The $100,000 psychological level now acts as the next major support. A breakdown below this could expose BTC to deeper losses, possibly toward the $76,000-$78,000 zone that served as a breakout base in late 2024.
However, the bullish narrative remains intact for long-term holders, as smart money continues accumulating despite short-term turbulence. As Gaah noted, there is no indication yet of a definitive cycle top.
Retail Capitulation Fuels Institutional Entry
The rapid cascade of liquidations points to forced exits among overleveraged traders. More than 200,000 traders were liquidated in the last 24 hours, losing $675 million, according to Crypto Rover’s data.
The liquidation flush enabled larger players to re-enter. VanEck, Fidelity, and BlackRock’s combined $185.7 million purchase highlights a possible shift in ownership from weak hands to long-term holders.
Meanwhile, long-term cycle models remain cautious. Gaah’s IBCI analysis underscores that while the market hasn’t topped, the distribution zone historically leads to interim pullbacks. Timing remains uncertain.
BTC has continued to form higher lows since the Aug. 2024 crash, suggesting the broader uptrend remains intact. For now, traders will watch the $115K support and upcoming macro data for clues on BTC’s next move.
Disclaimer
This article is for informational purposes only and provides no financial, investment, or other advice. The author or any people mentioned in this article are not responsible for any financial loss that may occur from investing in or trading. Please do your research before making any financial decisions.