Zylo Ecosystem
 Walrus
 Bitcoin
 Sui
Sui Quantus
 Quant
Quant Starknet
Key Insights:
- Pi coin generated around $100 million in daily trading volume on exchanges like OKX and MEXC, highlighting its strong market demand.
- Binance appears to be refraining from listing PI until it fulfills all KYB listing requirements, including the need for clear tokenomics and a public roadmap.
- Pi Coin slipped from $0.47 to $0.44, losing all recent gains and reaching a key support level.
Pi Coin is once again making waves in the cryptocurrency realm with its impulsive price momentum. According to CoinMarketCap data, during the Asian trading hours, the asset reached a high of $0.4706 but later slipped significantly, losing nearly all of its gains.
Pi Coin Price and Expert’s Bold Claim
When writing, Pi Coin traded at $0.444, recording a 0.60% gain over the past 24 hours. This notable price fluctuation may be a key reason behind the surge in trader and investor participation. Data from CoinMarketCap reveals that Pi’s 24-hour trading volume soared by 230% to nearly $100 million.
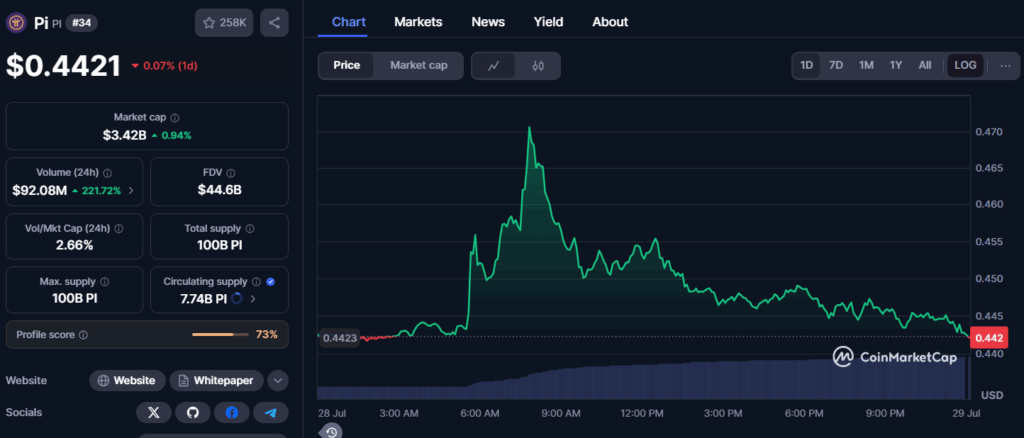
Despite the price struggling to gain momentum, a crypto expert shared a post on X (formerly Twitter) stating that Pi is already generating around $100 million in daily trading volume on exchanges like OKX and MEXC. That highlights its strong market demand and positions it as a highly lucrative opportunity for other CEXs.
It’s only a matter of time before Pi is officially listed on top-tier CEXs, most likely around 2026 or 2027.
Why Does Pi Coin Price Seem to Be Struggling?
The potential reasons behind the price slipping after reaching $0.4706 include the significant unlocking of 8.4 million Pi tokens, delays in the Binance listing, and the lack of a complete picture of its tokenomics and a clearly outlined roadmap.
Additionally, mass user migration to the mainnet and increased developer engagement have also contributed. Several other issues faced by investors have recently surfaced on X (formerly Twitter), including delays in KYC verification, problems with 2FA, and wallet balance errors.
These are all the reasons behind Pi Coin’s failure to gain momentum. So, when it appeared unable to sustain, sellers took the opportunity to dump their holdings.
Pi Coin Price Action and Technical Analysis
According to expert technical analysis, Pi Coin, following notable price fluctuations, has now reached a key support level at $0.435. The daily chart reveals that the asset has been testing this level since July 29, 2025.
Based on the price action, if this level is breached, Pi Coin could face a downside move of 8% until it finds its next support at the $0.40 level.
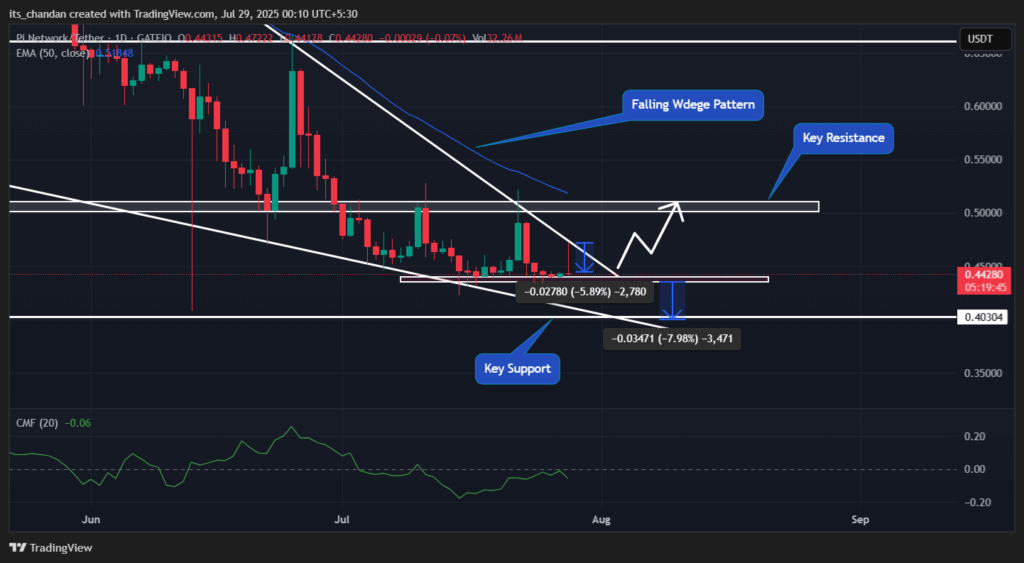
Besides this price action, Pi Coin has also formed a bullish falling wedge pattern on the daily time frame. As days progress, the price is moving toward a narrow range, suggesting a potential breakout ahead.
It seems like this breakout could also bring upside momentum. However, for that to happen, the asset needs to break out and close a daily candle above the $0.46 level.
A quick rally could only begin if the asset closes a daily candle above the $0.515 level. If not, it may continue its sideways momentum in the upcoming days.
At press time, Pi coin’s CMF stood at -0.06. It indicated a slight selling pressure and suggested that capital outflows are currently outweighing inflows.
Whereas, the asset was still trading below the 50-day Exponential Moving Average (EMA) on the daily timeframe. It suggested that the broader trend remained bearish and the market could continue to face downward pressure unless a strong reversal occurs.
Disclaimer
This article is for informational purposes only and provides no financial, investment, or other advice. The author or any people mentioned in this article are not responsible for any financial loss that may occur from investing in or trading. Please do your research before making any financial decisions.