Walrus
 Quantus
 Pudgy Penguins
 Bitway
 Quant
Quant Sui
Sui Bitcoin

Key Insights:
- Solana price traded near key support at $184, setting up for a potential rally.
- Analysts forecast that a breakout above $200 could send the Solana price toward $360.
- Solana has consolidated at $180, indicating high upward momentum as long as it maintains this level.
Solana price has shown potential for a breakout, with analysts targeting a price surge towards $360. Key levels in the current price action suggest that the SOL price may experience upward movement.
Traders are also keen on the support and resistance levels as the market is moving towards consolidation.
Bullish Breakout Scenario for Solana Price
Analyst Ali Martinez identified an ascending triangle emerging in the Solana price chart. He said that the breakout of this formation could push SOL above the $200 resistance. Ali’s analysis suggested that this move could surge $360.
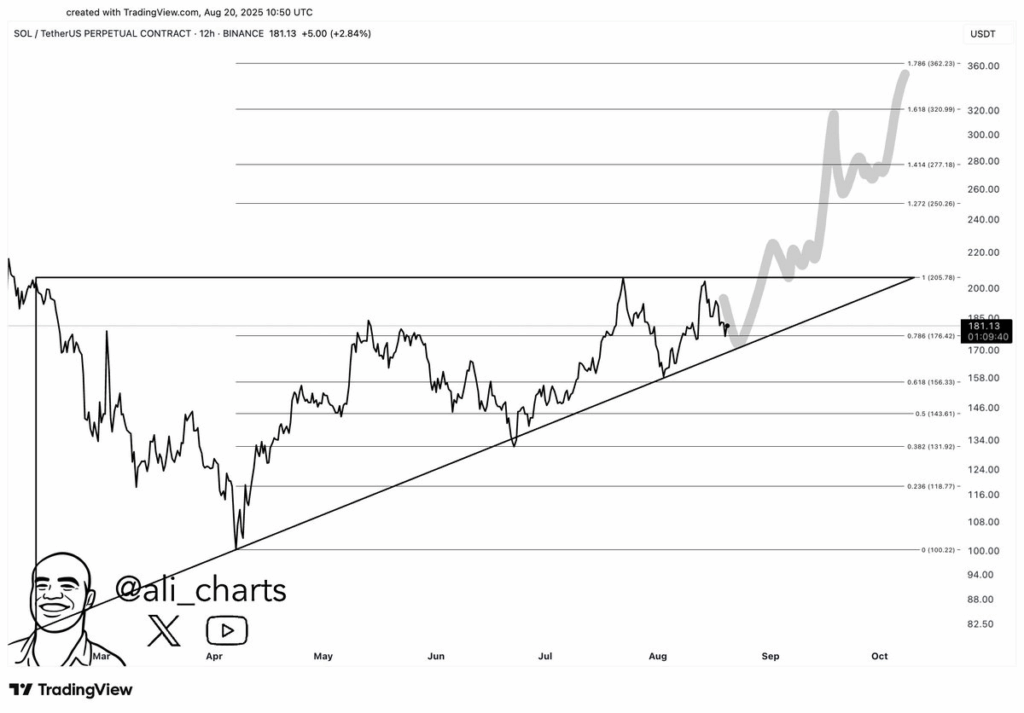
As Ali suggested on his chart, this level offered great support before it continued to propel Solana higher. The analyst anticipated a breakout following the bullish trend that is developing.
To traders, the perfect entry point is at the current price levels before reaching the anticipated breakout. According to Ali, a break above the $200 mark was confirmed, and further positive moves are likely.
Support Levels and Short-Term Outlook for SOL Price
Cardzzz, a crypto analyst, indicated that the key level of support at $184 is essential in the short-term SOL price trend.
Based on his analysis, the top altcoin may increase toward $195 if the support is maintained. Cardzzz highlighted the significance of Bitcoin’s performance in influencing Solana price movements.
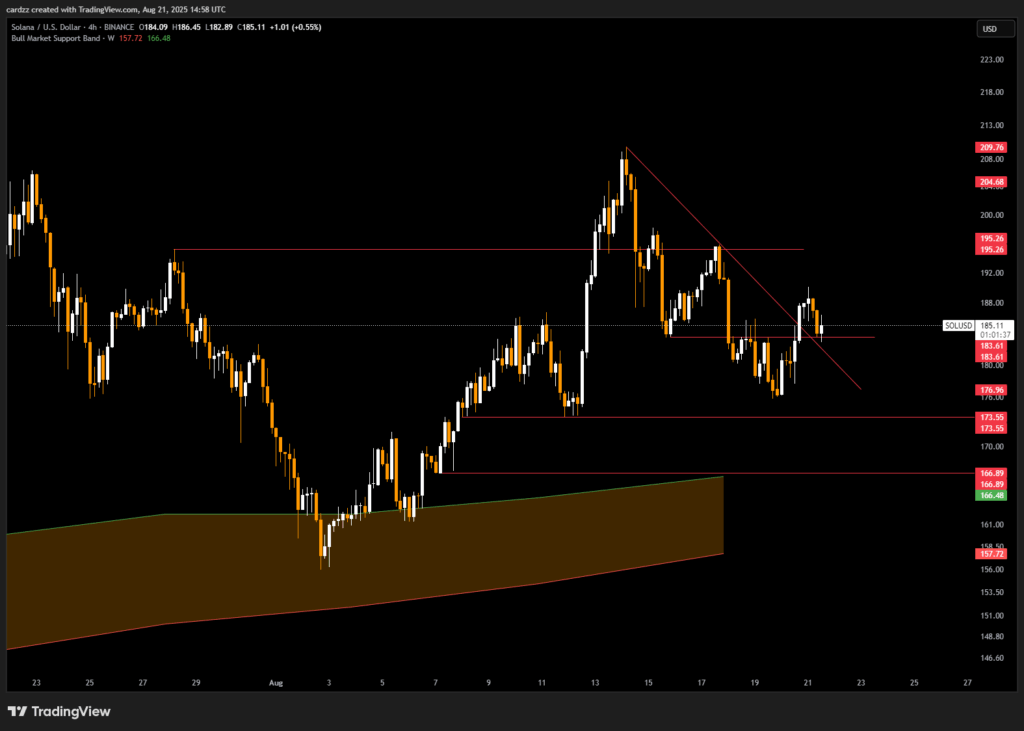
However, Cardzzz has observed that a limited movement in price could take place over a short time. He indicated that the Jackson Hole meeting was one of the cases that could result in volatility.
Failure to hold the $184 support could see SOL price test the Bull Market Support Band at $157.72. This area is Solana’s strong support turnaround point, giving traders potential buying opportunities.
Technical Indicators for Solana Price
Meanwhile, SOL price action is guided by several key technical indicators. The Relative Strength Index (RSI) was near neutral at press time. This suggests neither overbought nor oversold conditions. This meant that there could be a further drift in either direction.
The MACD also indicated a bullish momentum. This supports the fact that the Solana price is on an uptrend. Solana is at the test of the 0.618 Fibonacci retracement level. It has been a significant point of price reversals in the past.
Notably, at the time of writing, the Solana price was consolidating near $184. With this, traders are watching whether this support would hold. A break above $200 would propel the price to the other resistance levels.
Range-Bound Strategy for Solana Price
However, another noted analyst, KenCharts, is pessimistic about Solana. He believed the altcoin price would likely revisit the $155 range before any bullish movement. His analysis indicated that the price might range between $210 and $150 following the $155 support.
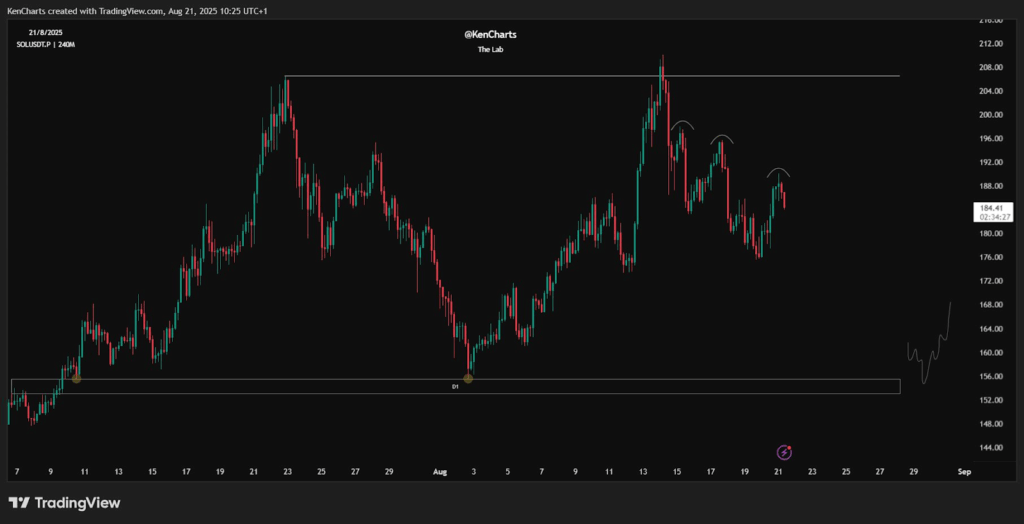
KenCharts observed that the SOL price was positioned around $185. This suggests the market is in a consolidation phase. KenCharts stated that patience is a crucial thing to consider for traders looking to enter the market at the best prices.
As per analysts, the support of $155 is a critical level for the top altcoin. If Solana price holds in this zone, a move towards the upper direction may materialize. However, a drop below $155 would indicate further consolidation or a possible reversal trend.
Disclaimer
This article is for informational purposes only and provides no financial, investment, or other advice. The author or any people mentioned in this article are not responsible for any financial loss that may occur from investing in or trading. Please do your research before making any financial decisions.