
 streamoors
 IGNITION
 Sword Inu
 no crying in the casino
 Altai the Tiger
 Pearl
Pearl Pudgy Penguins

The Ethereum price has been stuck in a tight range this week, continuing a consolidation phase that began in early August. ETH was trading at $4,420 on Friday, down by 10% from its highest point this year. So, is Ethereum a good buy as ETH ETF inflows rise?
Is Ethereum Price at Risk as ETH ETF Inflows Fall
Ethereum price remained in a tight range this week, mirroring the performance of Bitcoin and other cryptocurrencies. This price action happened as investors waited for the US non-farm payroll (NFP) data.
ETH also wavered a Ethereum ETF inflows slowed, ending a multi-week trend in which it experienced substantial inflows. SoSoValue data shows that these ETFs had net outflows worth over $167 million on Thursday, up from $38 million a day earlier.
The funds have shed over $500 million in assets, bringing the cumulative inflows since their inception to over $13.17 billion. This week’s outflows are happening after they added $1.08 billion in assets last week.
BlackRock’s ETHA ETF maintains its dominance in the Ethereum ETF industry with over $16 billion in assets. Grayscale’s ETHE has over $4.56 billion in assets, while Fidelity’s FETH has $3.1 billion.
Still, the falling ETH ETF inflows this week are not a sign that a new Ethereum price bear market is starting. It is normal for all types of funds to have outflows, especially when the price is not doing well.
ETH Price Has Numerous Catalysts This Year
Ethereum price has major catalysts that will boost its performance in the coming weeks. First, the network will implement the Fusaka upgrade in November, introducing new features, like increasing the gas limit from 36 million to 45 million, a move that will boost its throughput.
Fusaka will also introduce Peer Data Availability Sampling, increase contract code size limit from 24kb to 256kb, improve the nodes, and boost the support of layer-2 networks.
Historically, the Ethereum price tend to jump before and after a major upgrade happens. For example, the coin emerged from a consolidation phase and surged recently after the Pectra upgrade that introduced account abstraction and an increase in effective balance for validators.
The other major catalyst for Ethereum price is the ongoing accumulation by companies, which are aiming to emulate the success of MicroStrategy, which became a behemoth by accumulating Bitcoin. These companies now hold over 3.6 million ETH coins, with BitMine holding coins worth $7.5 billion and SharpLink having $3.5 billion.
Further, Ethereum is dominating key industries in the cryptocurrency industry, with no blockchain network coming close. A good example is the decentralized finance industry, where it has over $201 billion in direct assets and $501 billion in bridged assets.
Solana, which comes in a distant second, has a TVL of $25 billion and $35 billion in bridged assets.
The same happens in the stablecoin industry, where Ethereum has over $153 billion in assets compared to Solana‘s $12 billion and Tron’s $80 billion.
Ethereum Price Technical Analysis
The daily timeframe chart shows that the ETH price has been in a strong bullish trend this year. It has remained above the 50-day and 100-day Exponential Moving Averages, a sign that the bullish momentum is intact.
Most importantly, the coin has formed a bullish pennant pattern, which is made up of a vertical line and a symmetrical triangle pattern. The current consolidation is part of the formation of the triangle pattern.
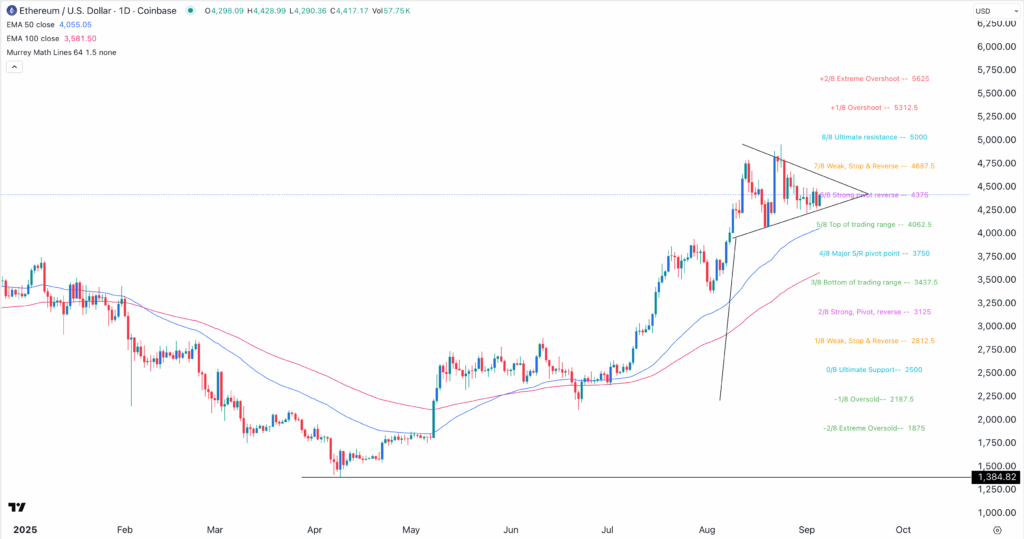
Therefore, the coin will likely have a strong bullish breakout in the coming days as bulls target the important resistance level at $562, the extreme overshoot level of the Murrey Math Lines, about 27% above the current level.
The bullish Ethereum price forecast will become invalid if it moves below the major support and resistance level at $3,750. A drop below that price will point to more downside




